Friday, March 30, 2012

Friday Evening

The first trading quarter of 2012 is officially over. Personally, I had some good days and I had some bad days. I thought it would be a good time to read through and reflect on a "Trader's Self-Evaluation Checklist" written by Brett Steenbarger, Ph.D.

1. What is the quality of your self-talk while trading?  Is it angry and frustrated; negative and defeated?  How much of your self-talk is market strategy focused, and how much is self-focused?  Is your self-talk constructive, and would you want others to be talking with you that way while you’re trading?

2.  What work do you do on yourself and your trading while the market is closed?  Do you actively identify what you’re doing right and wrong in your trading each day—with specific steps to address both—or does your trading business lack quality control?  Markets are ever changing; how are you changing with them?

3. How would your trading profit/loss profile change if you eliminated a few days where you lacked proper risk control?  Do you have and strictly follow risk management parameters?

4. Does the size of your positions reflect the opportunity you see in the market, or do you fail to capitalize on opportunity or try to create opportunities when they’re not there?

5. Are trading losses often followed by further trading losses?  Do you end up losing money in “revenge trading” just to regain money lost?  Do you finish trading prematurely when you’re up money, failing to exploit a good day?

6. Do you cut winning trades short because, deep inside, you don’t think you’ll be able to make large profits?  Do you become stubborn in positions, turning small losers into large ones?

7. Is trading making you happy, proud, fulfilled, and content, or does it more often leave you feeling unhappy, guilty, frustrated, and dissatisfied?  Are you having fun trading even when it’s hard work?

8. Are you making trades because the market is giving you opportunity, or are you placing trades to fulfill needs—for excitement, self-esteem, recognition, etc.—that are not being met in the rest of your life?

9. Are you seeking trading success as a part-time trader?  Would you be seeking success as a surgeon, professional basketball player, or musician by pursuing your work part-time?

10. Can you identify the specific edges you possess over the many other motivated, interested traders that fail to achieve success in the markets?  Do you really have an edge, and—if so—what are you doing to maintain it?

Friday Afternoon


S&P futures have recovered back to about where they opened this morning at in V-shaped fashion... and I get the sense that the next flurry of activity won't come until the last hour as managers square up for quarter end.  

With the Mega Millions buzz growing by the minute, I thought this pic was appropriate. I think I heard a bobble head say earlier they were projecting $1.2 billion in ticket sales  - and with only having to pay out less than half of that (assuming someone wins), sounds like a decent gig. Seems obvious who the real winners are. Just sayin. 

Full Disclosure: Long one ticket... lol.

Friday Morning


The SP500 is the heavy green line. The top chart is the entire first quarter (plus a couple of days of December I think). The bottom chart is March only. Same comparisons. Sector rotation if you will. Comparisons are to EFA (General Europe); EWG (Germany); EWW (Mexico); EWP (Spain); RSX (Russia); EWC (Canada); EWZ (Brazil); EWQ (France) and EWU (UK) as well as the FXE (the Euro for us non-Forex traders). Note that Spain is pretty lousy on both time frames.

Thursday, March 29, 2012

Thursday evening thread


Big green bars on the chart mean something. Big green bars on the chart accompanied by big volume bars mean something. MCP gapped down on earnings. Then it gapped up on an acquisition and consolidated above the earnings move. When a stock does this ... "I'm giving you pearls here."

Thursday Afternoon

S&P Futures Hourly Chart
The S&P futures have pulled back into an important support zone today. The 1380-1390ish area is where we saw a heavy volume exchange on March 13th. I put arrows on the chart above showing the March 13th push up and the corresponding volume. It's premature to suggest a head and shoulders topping pattern, but it almost looks like we could use a right shoulder rally up to that 1403-1406 area. Either way, the bulls have some work to do in order to hold support around 1380.

Thursday Morning Thread

Gator's Chart of the Day: FCX
Last time we looked at Freeport McMoRan was following the action on 3/20 (in the ellipse) where it printed a pretty green candle with a tail on increasing volume.  I said the support line looked good and I was looking for a move higher.  It didn't last long.  Now that support has failed on the highest volume since January or maybe all the way back to October a new plan seems appropriate.

The news from China now suggests they could be slowing more than expected and the hard landing phrase is being used again.  With that in mind it could be the right time to short or buy some puts.  A fall to 35 or lower seems to fit the picture.  That would require a close outside of the lower Bollinger band if it is to happen soon so it could take a few days to complete.  My record with puts is not exactly stellar but I may try again with FCX.

Edit: A "buy stop" or sell the puts would be appropriate if the stock moves back above the lateral white line.  

Wednesday, March 28, 2012

Wednesday Evening Thread

A frustrating day was had by many traders today. The major indices finished off their lows, but still fairly negative on the day. I have been tracking sector performance here at the end of the quarter, and can report that today there were 3 sectors which finished green on the day: AAPL, the XLF and XHB. What a mixed bag. Whew. Worst performers on the day were KOL, XME, XLB and XLE. That group at least pretty predictable.

The XHB chart above is indicative of some of the "confusion" lately. Data from the hombuilding sector has been mixed, at best, in the last week. Yesterday a gravestone doji was printed, and yet today the group finished higher. Doubtless some of that is "window dressing" as the XHB is the best performing group on my list for the first quarter of 2012 (unless you really put AAPL and PCLN as their own sector.)

Wednesday Afternoon

For the last several weeks the theme has been jbtd. The pullback today in the SPY closes the gap from Monday's open....

Wednesday Morning Thread

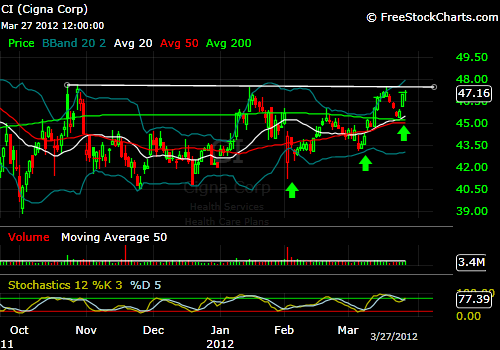
Gator's Chart of the Day: CI
Health care is a hot topic this week with the Supreme Court hearing arguments on Obamacare and the individual mandate.  We won't know the outcome for certain until June but there is a lot of trading to be done before then.  Cigna Corporation is a provider of health care plans which are sure to be affected.

The stock has made a series of higher lows (arrows) and is up against resistance that has been impenetrable on multiple tests over the last 6 months.  If you pound on something long enough it is likely to give way.  I think it will require one more pullback to the 45.50 area which also is the confluence of the 20/50/200 day simple moving averages but it could just pop through resistance instead.  I'll set a price alert for 47.50 and make a decision when it is triggered.

Tuesday, March 27, 2012

Tuesday Evening

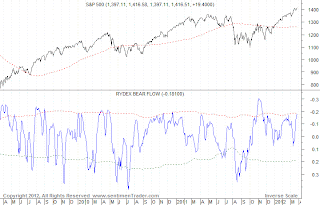
Sentimentrader Rydex Bear Flow Indicator

Sentimentrader Rydex Bull Flow Indicator

The markets drifted around flat most of the day and the bears stepped in during the last hour to close the S&P futures on the low of the day (1406). It's been awhile since we've looked at the Rydex indicators... so I thought I would put them up tonight. The bull flow indicator doesn't look all that bad... but the bear flow indicator is suggesting we've lost a good amount of the short base in the market.

Tuesday Noon Thread

CAT daily chart


The last time I posted something from my short list - SMG - baron went long and made money. LOL. CAT. see what you think.

Tuesday Morning Thread

Gator's Chart of the Day: CERN
I have only shown the daily chart for CERN from the middle of January to present.  Why?  It's the only segment that matters.  The stock has cleared all resistance and is at an all-time high and volume has been increasing.  It looks ready to move up but if you decide to own it you'll need to pay attention to the news regarding the Supreme Court review of Obamacare.

"Cerner Corporation designs, develops, markets, installs, hosts, and supports healthcare information technology, healthcare devices, and content solutions for healthcare organizations and consumers worldwide. It offers the Cerner Millennium architecture, which combines clinical, financial, and management information systems that provides access to an individual's electronic health record (EHR) at the point of care, and organizes and delivers information for physicians, nurses, laboratory technicians, pharmacists, front and back-office professionals, and consumers. The company also provides the Healthe Intent platform, a cloud-based platform that sits above existing EHR systems and is designed to contain data from any EHR along with claims data, medical evidence, and research to facilitate proactive care. In addition, it offers a range of services, including implementation and training, remote hosting, operational management services, revenue cycle services, support and maintenance, healthcare data analysis, clinical process optimization, transaction processing, employer health centers, employee wellness programs, and third party administrator services for employer-based health plans. The company serves integrated delivery networks, physician groups and networks, managed care organizations, hospitals, medical centers, reference laboratories, home health agencies, blood banks, imaging centers, pharmacies, pharmaceutical manufacturers, employers, governments, and public health organizations. Cerner Corporation was founded in 1979 and is headquartered in North Kansas City, Missouri." .... Finviz

Monday, March 26, 2012

March 26 Evening Thread

I wanted to highlight OSIS.  It is in a daily volatility squeeze where it is just breaking out.  You can see it has been consolidating on declining volume and is breaking out on higher volume.  Even through the consolidation the Macd has been pegged as oversold.  I am long a small position.  

The weekly chart shows the current rise.

OSI Systems, Inc., together with its subsidiaries, designs and manufactures electronic systems and components for homeland security, healthcare, defense, and aerospace markets worldwide. The company operates in three divisions: Security, Healthcare, and Optoelectronics and Manufacturing. The Security division provides security and inspection systems under the Rapiscan Systems name. Its products include baggage and parcel inspection, cargo and vehicle inspection, hold baggage screening, and people screening products to search for weapons, explosives, drugs, and other contraband, as well as for the verification of cargo manifests for monitoring the export and import of controlled materials. This division also offers various turn-key security screening solutions under the S2 trade name. The Healthcare division provides patient monitoring, diagnostic cardiology, and anesthesia delivery and ventilation systems under the Spacelabs name that are used in critical care, emergency, and perioperative areas within hospitals, as well as physician’s offices, medical clinics, and ambulatory surgery centers. The Optoelectronics and Manufacturing division offers optoelectronic devices for the aerospace and defense, avionics, medical imaging and diagnostic, renewable energy, biochemistry analysis, pharmaceutical, nanotechnology, telecommunications, construction, and homeland security markets under the OSI Optoelectronics name; and electronics manufacturing services to original equipment manufacturers under the OSI Electronics name. This division also provides laser-based remote sensing devices to detect and classify vehicles in toll and traffic management systems under the OSI Laserscan name; blood pressure cuffs and unifusors under the Statcorp Medical name; and solid-state laser products for aerospace, defense, telecommunication, and medical applications under the OSI LaserDiode trade name. The company was founded in 1987 and is headquartered in Hawthorne, California

Monday Afternoon Thread

ALLT Daily Chart (as of 11:30 EDT)
We haven't talked about this one in a long time.  I think it was originally a beaky mention but IBD mentioned it in a positive way in today's print edition.  It move up on big volume (3/13) and then printed a little bull flag.  Now it's on the move again.

The company is a network security play.  They do deep packet inspection and that is a hot area.

Monday Morning Thread

LNKD Daily chart


LNKD broke out on strong volume last Wednesday from an extended base on base. The immediate catalyst was an upgrade from GS. The breakout was in some question with the tombstone doji on Wednesday, but Thursday and Friday it consolidated the position trading back and forth across the 100 mark on declining volume. This is the kind of volume you want to see in a consolidation from a breakout.


I got nervous and took some profits on a portion of my position on Thursday when the stock opened lower into the gap but I will buy back if it dips again, or higher if I have to. I look to hold this stock through the Facebook IPO and I believe it will be the subject of "window dressing" accumulation. Year to date LNKD is up 57.91%, which is ahead of both PCLN (up 52.87%) and AAPL (up 47.17%)

Friday, March 23, 2012

Weekend Thread

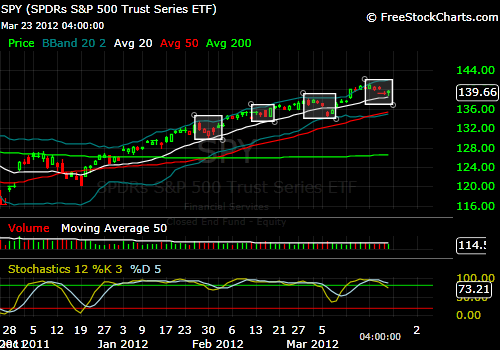
SPY Daily Chart
It was a down week but I think it can be logically argued that the broad market as represented by the SPY held up quite well.  In March the 20 day simple moving average was pierced and we actually spent 2 sessions below it.  This time we bounced from just above it.  A follow through on Monday could put is back on track for new 52 week highs.

Friday Afternoon Thread

CBOE Daily Chart as of 11:55EDT
It's a little on the thin side with average volume around 350k shares/day.  Closed outside the upper Bollinger band 4 days in a row and it's up there again today.  I might take a small position.

Friday Morning Thread

XHB Components compared since March 1


These are the seven best performing components for the XHB for the first quarter (LEN, KBH, SPF, HOV, BZH, PHM and MDC). That list should please those who like trading some of the low priced stocks. There are about 12 other stocks in the XHB. For the entire quarter to date, the hands down winner is HOV, even though it underperformed in March. Past performance is no guarantee of future results. In fact this chart indicates there may a little profit taking happening in some stocks.


KBH reports earnings this morning before the open, which could be the catalyst for a move in either the individual stock, or the entire group. You could hedge your bets by trading the XHB etf, as it is quite liquid and also has a very liquid options chain.

Thursday, March 22, 2012

Evening Thread


These 2 charts show the S&P500 since January 3, 2012 - the heavy green line in both charts. There are 10 comparisons on each chart. The best performing sector was AAPL. Followed by homebuilders, financials (!), retail. Where did you NOT want to be? bonds. gold. utilities. metals and mining. transports. "consumer non-discretionary."


Next quarter is likely to look different. We will start getting clues over the next 2 weeks as one quarter ends and the next one begins.

Thursday Afternoon Thread

NKE Daily (as of 11:40EDT)
Yes it's well extended above the 200 day but less that 5% above the 50 day and it tagged the 20 day this morning.  That 20 day has been a great place to buy and today could be a good time to start a position.  I'm thinking about it.

Thursday Morning Thread

Gator's Chart of the Day: TSCO
The chatter I've been hearing suggests farmers are going to have a lot of cash in their pockets and this is one of the places they like to spend it. The stock hit an all-time high (88.97) today before retreating into the close. The Bollinger band width is less than 5% of the 20 day simple moving average so it qualifies as a squeezer with a high base. With the market showing some weakness this week it may not be the right time to buy breakouts but this could be an exception.

TSCO Monthly Chart
As you can see from the monthly chart this stock has been immune to any downturn for years.

Wednesday, March 21, 2012

Evening Thread

VIX Weekly Chart

The Vix was lower today, but is near its lowest point in nearly a year. Profit protection mode may be in order. Some stocks moved up today while others moved down.

Wednesday Afternoon Thread

T Daily Chart
There's been a lot of talk about AAPL and other smart phones.  Also buzz about the price of data plans and how some networks are throttling customers on unlimited plans.  These data hogs are good for the carrier's bottom lines.  T has only danced with the 50 day simple moving average once this year.  That was a successful test in late January.  It has been overbought for more than a month now and still looks strong.  It has a 5.6% dividend for support and is in no danger of failing to pay it.  If you want a boring stock that pays you with dividend and capital appreciation this is a good one.

Wednesday Morning Thread

Gator's Chart of the Day: FCX
News Flash: China is slowing ... copper is in a bubble ... gold is weak ... yada, yada, yada.  All of that may be true but it sure looks like FCX has found support.  It's not because it's near one of the popular moving averages (they are all much higher) but buyers have shown up here and volume has been above the 50 day average for nearly 3 weeks.  The last 4 bars are green and the stochastic just flashed a buy signal. (You may have to trust me on that one because it's hard to see but the fast stochastic crossed up through the slow one yesterday and it poked up through 20 today.)

This looks like a good place to enter with a small (say 1/4 of normal) position and if it starts to move up with good volume then a quick add would seem appropriate.  A tight stop on the original buy, just under Tuesday's intraday low (37.90) makes this a low risk trade. 

Tuesday, March 20, 2012

Tuesday Evening Thread

Naz 100 Futures Commercial Hedger Combo

The bulls did a good job today of grinding it up after a weak open. The major indices closed down on the day except for the Naz 100... which closed up about 4 points. Given the reaction by ORCL in the afterhours session, I thought it might be interesting to take a look at the latest COT report for the Naz 100. The chart above is a combination of the large and small contract futures positions of Commercial Hedgers. 

When I look at this data, I wonder if... and at what point... it will have an impact on the uptrend. Over the last few years, these data points have not proven very useful unless at extremes. It appears we are approaching an extreme on this one, and I think it might be an indication we will see a correction fairly soon.   

Tuesday Afternoon Thread

New iPad Accessory
The new iPad is now being offered with a USB 2.0 external cooler.  Prices start at 39.95 for the plain flat black model but for an additional 14.95 you can get it in your school colors.  Just another clever marketing device to drive big bucks to the bottom line.

Tuesday Morning Thread

Gator's Chart of the Day: V
I ran the "constructive consolidation" scan that I picked up at the Worden seminar in Atlanta earlier this month and look what popped to the top of the S&P-500 list.  Visa has been building what some would call a high base and the Bollinger bands have constricted to just 3.8% of the 20 day simple moving average.  Volume has been increasing for the last 5 sessions and yesterday it traded above the upper band before closing just barely inside.  (I know you can't see that but trust me it's 12 cents inside.)


While the 50 day would be a nice buy point the price hasn't touched it in months.  It looks a bit extended but it really isn't.  The 50 is less than 8% below yesterday's closing price.  Barring some nasty news it looks like a right here right now moment.  

Monday, March 19, 2012

Monday Evening Thread

BAC Intraday Chart

The yellow line is Friday's close (9.80) which was above today's open (9.78). The stock traded up sharply in the first half hour on heavy volume. Sorry it is hard to see volume bars on this chart. In the last hour - often said to be controlled by the pros - BAC sold off on heavy volume and finished near the lows of the session.

Afternoon Thread

HAIN daily chart
We don't talk about this one and I've never owned it.  It is a bit extended and sports a trailing P/E of 31 (forward is 21) but the chart looks pretty good.  Volume is good so far today and if it closes near the high of the day it could be worth a starter position.  Cramer pumps it anytime he talks about it but I have not seen him mention it lately.

Post St. Patty's Monday Top of the Morning

SRZ Sunrise Senior Living, Inc. provides senior living services in the United States, Canada, and the United Kingdom. It offers independent living services, which include housing, meals, transportation, activities, and housekeeping, as well as licensed skilled nursing services for residents who require 24-hour skilled nursing care. The company also provides assisted living services with individual service plans, which comprise the selection of resident accommodations, and determination of the appropriate level of care and service for such resident; and reminiscence neighborhood that offers specially designed accommodations, service, and care to support cognitively impaired residents, including residents with Alzheimer’s disease. In addition, it offers medication management programs, including storage of medications, distribution of medications as directed by the resident’s physician, and compliance monitoring; and various levels of care for assisted living residents who require frequent or intensive assistance or increased care or supervision. As of June 30, 2011, the company operated 316 senior living communities, including 274 communities in the United States, 15 communities in Canada, and 27 communities in the United Kingdom, with a total unit capacity of approximately 31,000. Sunrise Senior Living was founded in 1981 and is based in McLean, Virginia. 

I am long a small amount of this stock.  We have seen the homebuilders already rise dramatically.  Can real estate and a company with vast amounts of it be far behind.  With an aging population there will not be a scarcity of customers.

SRZ One Year Daily showing cup and handle.  You have the correct order price above the 20 day, then 50 day, 200 day.

The weekly chart shows the 200 day pretty much defining the down trend which has been broken.  The stock has been consolidating right along the 50 day moving average.  MACD has just begun to turn up.

6 month daily showing a bounce off the 50 day after a month or so of sideways consolidation.  Volume spike on Friday could be signaling the beginning of a breakout. Now let's compare to BAC about a week ago.

BAC


The 6 month daily of BAC.  Same cup and handle, a dip down to the lower bollinger band, then recovers, consolidates at the 20 day then begins to increase in volume and price.  

Could we be seeing the start of this in SRZ?  Stops can be put around $7.15.  I also noticed that there seemed a relatively unusual amount of open interest in the April 7 1/2 calls.  They are selling at about .70.  Might be worth a look.

Friday, March 16, 2012

St. Patrick's weekend Thread


Options Expiration handled without casualties.


Next week there are a few big earnings reports including ORCL, GIS, FDX, LULU and NKE. In the meantime rest up from a nice week, and:


May you have the hindsight to know where you've been,

the foresight to know where you're going,

and the insight to know when you're going too far.

Afternoon Thread

FFIV daily chart
FFIV is making a move into the wireless network business.  (Story in today's IBD)  They bought an Israeli start up (Traffix Systems) last month and expect to be rolling out the product line next year.  Wireless data traffic is growing far faster than fixed line traffic and this should be a robust new revenue stream for FFIV.  I have no position but y'all know it is one of my long term favorites.

Friday Morning Thread

GOOG. A chart with a boatload of problems back in January. Sold off ahead of earnings - see those red bars before the nasty gap down. Then the nasty gap down on earnings. It has been trading sideways in a tight range between 600 and 620 for 6 weeks. Volatility squeeze. Close to the 50 day moving average, but in the last week it has started trading above the 50 day moving average and not below. There is still alot of overhead. I have no position. If it gets any higher though, I think you could consider it for a trade. (Baron - he of SMG fame - traded this one a tad this week as well. I was too busy staring at AAPL.)

Thursday, March 15, 2012

Evening Thread

Yikes!!!!   Apple is down!!!!!!!
Yes it's true.  AAPL printed a red candle today.  That's the 3rd one since Feb 22nd.  The market did just fine anyway.  Sooooooooo get a grip girlfriend. 

Thursday Afternoon thread

A couple weeks ago I posted a chart of FLEX - breakout of a generational downtrend.

Last weeks action produced a retest and nice springy bounce and this weeks action is producing some nice follow through.

Morning Thread

Gator's Chart of the Day: ACE
This is a chart that popped up on one of the scans I stole learned at the Worden seminar.  It's called "constructive consolidation."  We generally call it a volatility squeeze but it is designed to catch patterns that are just about to break out to the upside.  (At least the probability is high.)  You can see there is a well defined support line and while some would say (me too) it is an ascending triangle that could be a bit long in the tooth I think it's worth a look.  Earnings are on April 24th.

The stock trades with a 9.66 forward P/E and has no debt.  Fitch affirmed the company's ratings of A+ on Mar 9th and changed the outlook from stable to positive.  While it has only a 2.5% yield that's better than treasuries and it has a much better balance sheet than Uncle Sam.  The biggest negative is that it was recently upgraded by GS.

"ACE Limited, through its subsidiaries, provides a range of insurance and reinsurance products to insureds worldwide. The company's InsuranceNorth American segment offers various property and casualty (P&C), accident and health, and risk management products and services; property, general and excess liability, workers' compensation, commercial marine, automobile liability, professional lines, errors and omissions, medical liability, and aerospace insurance coverage; claims and risk management products and services; accident and other supplemental insurance programs; credit card enhancement programs; disaster recovery programs; medical managed care, integrated disability, and pre-loss control services; and salvage and subrogation, and health care recovery services, as well as peril crop and crop/hail insurance. Its InsuranceOverseas General segment writes various insurance products, including P&C, professional lines, marine, energy, aviation, political risk, specialty consumer-oriented products, and accident and supplemental health products. The company's Global Reinsurance segment provides property catastrophe reinsurance to commercial and personal property insurers; proportional property and per risk excess of loss treaty reinsurance; traditional and specialty property reinsurance, including casualty, marine, and aviation reinsurance; and medical malpractice reinsurance. Its Life segment underwrites protection and savings products comprising whole life, endowment plans, individual term life, group term life, group medical, personal accident, universal life, and unit linked contracts. The company was founded in 1985 and is headquartered in Zurich, Switzerland." --- Finviz

Wednesday, March 14, 2012

Evening Thread

Gold is trading below the 200 day moving average for the second time in a few months. Previous trip (not on this chart) below the 200 day average was in 2008. Oops.

Today we finished off the lows, but I would think any move back up to the 200 day average might be a shorting opportunity. The typically strong season for gold begins in Aug-Sept. The present weakness is due in part to strength in the dollar.

Afternoon Thread

COT Report - Gasoline Futures (Sentimentrader.com)

As the S&P500 churns around the 1400 level today, I thought it might be interesting to look at the latest Commitments of Traders report for unleaded gasoline (which is slightly up on the day as I'm typing). I don't follow this report on a regular basis, but I'm curious how this will play out going forward given the extreme positioning by speculators. Could this mean we won't see the $4-5-6/gallon prices everyone seems to be forecasting this summer? Time will tell.

Morning Thread

Gator's Chart of the Day: CHRW
Tuesday the DJ-20 (Transport Index) finally showed some upside movement and closed above its 50 day simple moving average.  With that in mind I'm looking at C.H. Robinson Worldwide, Inc.

The price is testing a long downtrend line and looks to be a good bet to pop above it.  Note that volume was just a little above the 50 day average and clearly higher than the previous red bar.  Also note that 4 of the last 5 bars are green.

If the stock closes above the downtrend line I expect that the horizontal line will become support.

"C.H. Robinson Worldwide, Inc., a third-party logistics company, provides freight transportation services and logistics solutions to companies in various industries worldwide. It offers transportation and logistics services, such as truckload, less-than-truckload, intermodal, ocean, and air freight transportation, as well as transportation management, customs brokerage, and warehousing services through contractual relationships with approximately 53,000 transportation companies, including motor carriers, railroads, air freight carriers, and ocean carriers. The company also engages in buying, selling, and marketing fresh produce. It offers its fresh produce to grocery retailers, restaurants, produce wholesalers, and foodservice distributors through a network of independent produce growers and suppliers under the Fresh 1, Tomorrow's Organics, Rosemont Farms, Melon Up, Tropicana, Welch's, Mott's, and Glory Foods names. In addition, the company provides payment management and business intelligence services, such as funds transfer, fuel purchasing, and online expense management primarily to motor carrier companies and fuel distributors. It operates through a network of 235 branch offices in North America, Europe, Asia, South America, Australia, and the Middle East. C.H. Robinson Worldwide, Inc. was founded in 1905 and is headquartered in Eden Prairie, Minnesota." ... Finviz

Tuesday, March 13, 2012

Evening Thread

JPM. Raised dividend. Buyback. I have none. In fact I have no financials. (Sing to tune: Yes I have no bananas.)

Good news from financials and lack of bad news from the Fed brought on a strong rally in all sectors today, except gold and utilities. Financials and tech were best performing. Usual suspects.

Bernanke Special Afternoon Thread

Bloggerz have been both active and chatty today. POTUS has spoken. Fed is next up.