
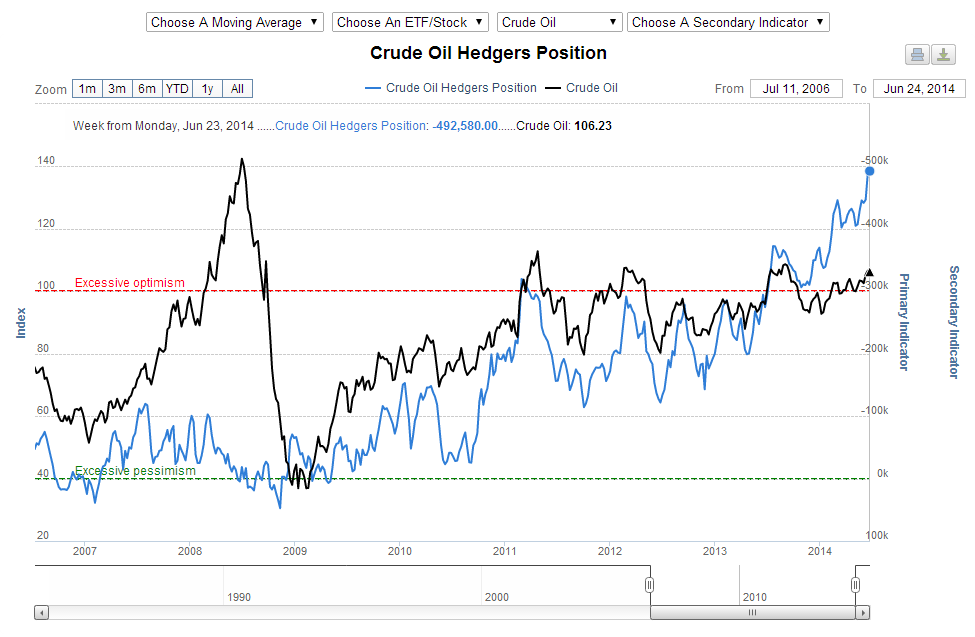
Anyway, I plotted the Crude COT commercial positions vs Crude Oil Index so you can see the correlation since about 2009ish. I've inverted the COT positions so it makes more sense visually. This is an intermediate to long term indicator..... and is giving the signal that we should expect to see weakness in oil moving forward. I posted a seasonality chart below so you can see the interesting calendar position we're in.
