

Monday, October 14, 2013

Monday morning
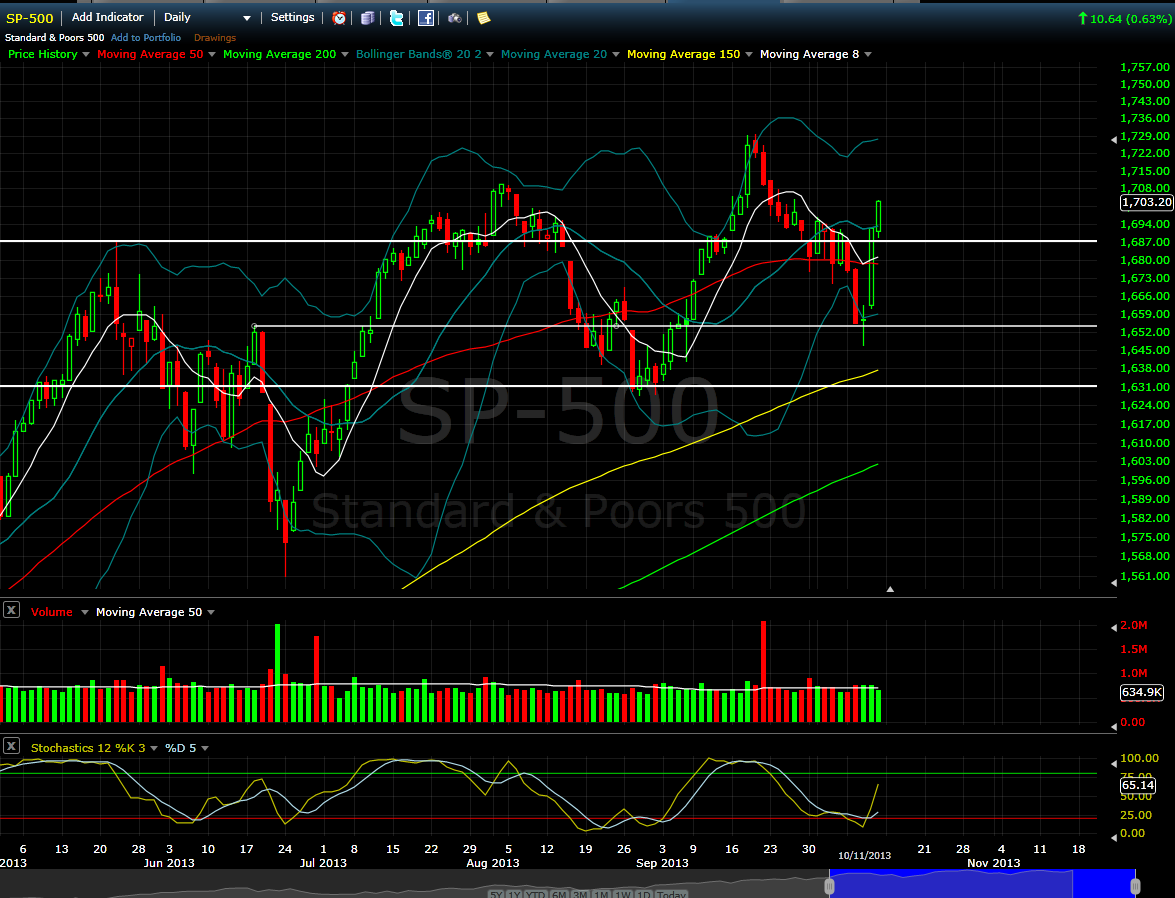 |
| SP-500 Daily Chart - Key Support Levels |
The horizontal white lines on this chart have been there since August 23rd. They appear to have accurately identified inflection points. As I write, the implied opening is just above the top white line. If it fails to hold, look for a retest of the 50 day simple moving average.
If you look closely you will see a thin white line that meanders just below the moves higher and just above the moves lower. That's the "southern line." (The uninformed might call it the 8 period simple moving average.) When the market is trending it is quite good for identifying buys and stops. You won't catch all of the move up and you won't get out at the top but you can do well if you respect it.