Tuesday, July 31, 2012

Tuesday Evening

10 Yr Futures Daily

30 Yr Futures Daily
A quick look at Treasury futures: You can see they made an attempt to break out and were quickly slammed right back into the range. They have now rallied right back up to the 20day WMA line and it looks like heavy resistance. The FOMC announcement tomorrow will most likely have an impact on rates going forward... and I'm wondering if this is the "writing on the wall".

EDIT: What I mean by that is.... Treasury futures are set up for another move down and that would mean S&P futures will most likely move up.

Tuesday Afternoon

BAS Daily Chart (11:10 AM)
Stock has bottomed and now moving higher.  The 20 day is ready to cross up through the 50 day and volume has been heavy.  If you check Finviz you'll see a target 60% above here and heavy insider buying.  I have no position .... and no excuse.

The company reported on 7/26 so that is behind them.
http://finviz.com/quote.ashx?t=bas

Tuesday Morning

Gator's Chart of the Day: MWIV
MWI Veterinary Supply Inc is a wholesale medical equipment company.  They reported earnings before the market opened Monday.  Results looked good with a bottom line of 1.15 vs 1.05 expected and the company guided higher.  Well ... apparently closer inspection found some folks wanting their money back as they sold heavily into the gap up.  The result is a classic "gap and crap" candle.

Is this a good place to buy?  For all intents and purposes the 50 day simple moving average held but where does it go from here?  The volume was 8X the average and before the day began 7.75% was sold short with nearly 12 days needed to cover.  Since the float is 11.86 million shares the short interest was about 900k so there is still a bunch left to buy back.  I suspect some was covered as the stock initially moved higher from the open. 

The Trade
This all depends on the open.  If the stock prints a higher open I think you can take a bite on the long side and put your stop just a bit below 97.  If a squeeze develops be prepared to add quickly and if it breaks 100 I would add more and move the stop on almost all of the position to about 99.60.  If the stop is not hit I would sell most as it approaches 110.

Monday, July 30, 2012

Monday Evening

I thought I would see how much I could cram on this post... lol. Sorry for the delay, I had some formatting issues. Anyway, first a few charts:

AAPL Daily
AAPL pretty much filled that gap at 600 today. It could continue higher, but I imagine a lot of bears are looking at this and seeing a decent short setup. Anything over 615ish would most likely stop them out.

SPX Daily
When you zoom out a bit on a daily chart of SPX, you can see how important that 1310-1330ish volume zone really is. When I look at this chart, I find myself wondering if we could really break out here. I'm not sure what the catalyst would be, but 1425 really isn't that far off. It seems more likely that we ping-pong around between 1350-1425 until the election... but we are at an interesting spot right now. The bearish case gets stronger on a break below that volume zone.

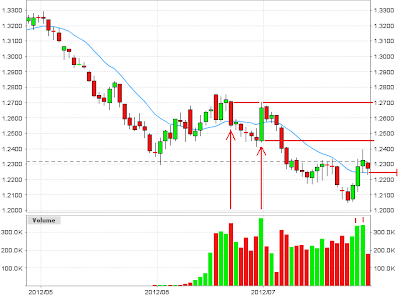
Euro Futures Daily
Euro futures pulled back today and tested the 20day WMA line at 1.2240ish. There is potential for a push back up towards 1.2700... and that would probably correlate with the SPX pushing towards 1425ish. That whole area between 1.2450-1.2700 will most likely be tough resistance if the bulls push it up there.


Ok, on to more important things.... lol. I promised a pic of my pup Ruby. This is a little blurry, but is one of my favorites because she is licking her lips for a carrot... lol. Ruby loves carrots and carrot juice. When someone says "treat", she gets excited because she thinks carrots are coming. The one time I took her inside my local bank, they tried to give her a dog "biscuit" and she just looked at it... lol.


I looked for a while to find something for relaxation that wasn't just a photo. I found tons of videos out there, but I will have to dig through them some more to find the good ones. This one is pretty good if you enjoy waterfalls. 

Monday Afternoon

SPX Daily
Short term indicators have come off a little since Friday's "ripe for selling"' readings, but still have room for more selling. 1355-1375 on SPX should hold as support considering the high volume zone sitting there. S&P futures daily pivot is 1373ish... which is equivalent to 1377 on SPX. That 1377 level is also the Fibonacci level that Trading Nymph noted on the Morning post. I'll be watching that level closely should it get tagged this afternoon. 1373ish on futures would also be the bottom end of a potential 10-15 point range day.

Monday Morning


Well, we are at a KEY LEVEL again. The SPX is at its 78.6% range from the move of 2007/2009 in my Fibonacci world at 1377ish. Us, Bears have been beaten up for the last two days over every possible rumor around how Europe is going to be saved..yet with everything eur/usd is back to 1.2260.  As everyone slept, the Shanghai Comp sold off into the close going into March 2009 range. Spain Posted a continue drop in GDP, posting a -.4%..ouch. In the Europe Session we have aud/usd at 1.0468... 6.65% for Spain 10 year and 5.88% Italy 10 year with a bond auctions tonight for Italy. During the weekend a poll came out showing a huge drop in support for Merkle on how she is handling the crisis fwiw. HSBC reported earning tonight and beat estimates, but stock is flat. Dallas Fed is really the only econ news in the US Session today..Our biggest wait and see moment today could be any news out of the Meeting of our Treasury Secretary Timmy Geithner  and Super Mario Draghi, everyone will be looking for  hints of central bank plans.

When it comes to what the Central Banks can do this week...the Bank of England may cut rates to Zero, but their QE stimulus fell flat last month so I don't expect anything else from them. The Fed gave us Operation Twist last month and with the GDP being above estimates I see nothing out of them this week. For Super Mario, he really doesn't have the tool box that our Fed has. He talked about how LTRO really didn't bring money into the market in his last press conference (well except for France), the Bond buying program didn't do much and really upsetted the Germans by doing it. Ah, Euro Bonds, over Merkel's Dead Body (btw, probably her worst Vacation yet..wonder if she has enough money for the second week). Spain is coming out tonight saying they will not ask for European funds to buy its debt despite the fact that the country needs its borrowing costs to fall soon. The market has been going crazy for two days...but, I agree with David Durst on CNBC on Friday, when he said that the ECB is Running on Empty.

Friday, July 27, 2012

Weekend Thread

Colorado
I hope everyone has a happy and safe weekend!   

Friday Afternoon

S&P futures intraday volume count is suggesting a 15-20 point range today. The low of the day session is 1360ish and that puts the high target area at 1375-1380. The weekly R1 is 1376ish, and daily R2 is 1378... so keep an eye on those levels if the bulls push up there. S&P futures are currently trading at about a 4 point discount to SPX, which puts a high target area of 1379-1384 on the cash index.

Friday morning


What ?  You expected a cat ?

Thursday, July 26, 2012

Thursday Evening

SPX Daily
The bulls stepped up today and provided a bounce right into heavy resistance on the S&P500 between 1355-1375. This is probably going to be a tough spot for the bulls. So far, there are a few positive reactions to earnings... AMGN & PCLN are up, and AMZN, SBUX & FB down..... although AMZN keeps trying to claw its way back to positive. FB has pretty much done a face plant... no "likes" from anybody so far. The S&P500 doesn't look too bad, although the bulls will probably need to get active in the futures market tonight for this rally to continue. A close above 1375 on SPX opens up the potential for 1400. 

Thursday Afternoon

Gold Futures (Aug) Daily
Gold is poking up through a descending triangle pattern that has been in play for a few months. If it's a fakeout move, it will most likely fall back under 1600 within the next few days. I don't believe it's a fakeout though... and if it comes back down to the 1600ish level, I'm betting the bulls will step in and hold it. There hasn't been a noticeable change in the Hulbert Gold Sentiment data since I posted it HERE. In addition to that, the latest Public Opinion data from Sentimentrader.com (updated every Wednesday) is showing a bullish reading as well. All things considered, as we head into the strongest few months of the year, I'm more interested in buying the dips than selling the rips.

Thursday Morning

Gator's Chart of the Day: SP-500
Sometimes all of those fancy lines and averages and bands and channels and assorted whirligigs just clutter up a chart.  This one is pretty basic. The pattern is clear and if it continues then the next few days should be up from here.

Expect the expected.  If it doesn't happen then that tells you something and you make adjustments or you get run over. 

Wednesday, July 25, 2012

July 25 Evening Thread


After a day like today, it seems like some jokes are in order.


New Investment Definitions

These terms have been redefined to fit current circumstances:

CEO - Chief Embezzlement Officer.

CFO - Corporate Fraud Officer.

BULL MARKET - A random market movement causing an investor to mistake himself for a financial genius.

BEAR MARKET - A six to eighteen month period when the kids get no allowance, the wife gets no jewelry, and the husband gets no sex!

VALUE INVESTING - The art of buying low and selling lower.

P/E RATIO - The percentage of investors wetting their pants as the market keeps crashing.

BROKER - What my broker has made me.

(S&P) STANDARD & POOR - Your life in a nutshell.

STOCK ANALYST - Idiot who just downgraded your stock.

STOCK SPLIT -- When your ex-wife and her lawyer split your assets equally between themselves.

MARKET CORRECTION - The day after you buy stocks.

CASH FLOW - The movement your money makes as it disappears down the Toilet.

INSTITUTIONAL INVESTOR - Past year investor who's now locked up in a Nuthouse.

MOMENTUM INVESTING - The fine art of buying high and selling low.

'BUY, BUY' - A flight attendant making market recommendations as you step off the plane.

FINANCIAL PLANNER - A guy who actually remembers his wallet when he runs to the 7-Eleven for toilet paper and cigarettes.

CALL OPTION - Something people used to do with a telephone in ancient times before e-mail.

YA HOO - What you yell after selling all you owned to some poor sucker for $240 per share.

WINDOWS - What you jump out of when you're the sucker that bought Yahoo for $240 per share.

PROFIT - Religious guy who talks to God.

And so it goes.

Wednesday Afternoon

I was flipping through commodity charts last night and found an interesting pattern in Corn that I hadn't noticed yet. When you zoom out to a very long term chart, it's pretty obvious what it looks like.

Corn Weekly
There is some debate over the effectiveness of cup and handle patterns with this long of a duration, but it looks pretty solid to me. If it holds this area and continues higher, it could have major implications for inflation in the future.

Corn Seasonality (Sentmentrader.com)
Seasonality indicates this time of year is generally weak for corn. The recent strength in corn (and other grains) has been primarily attributed to drought conditions throughout the Midwest region. Corn also has the ethanol component and rising demand from Asia. All things considered, it certainly appears that we have a recipe for serious food inflation going forward. This will start filtering through the economy in the months ahead and I thought it was worth looking at.   

Wednesday Morning

Gator's Chart of the Day: RPAI

Retail Properties of America is about as far from AAPL as you can get.  Right now I think that's a good thing.  You may remember that the market has been trading down for the last three days.  Each one was 100+ DJIA points and Wednesday looks like another ugly open.  RPAI has printed green candles each of those days.

The stock hasn't been trading very long ... just since April 5th.  It is pushing on it's all-time high (9.83) and if I wasn't so lazy I would have drawn the flat top triangle but you'll have to use your imagination.  If we get any kind of positive news RPAI could move higher.  It is thinly traded so be careful of you decide to take a position.  (They report earnings August 6th after market.)

"Inland Western Retail Real Estate Trust, Inc. is a real estate investment trust. It engages in acquisition, development and management of properties. The trust invests in the real estate markets of United States. Its portfolio consists of retail properties, including lifestyle, power, neighborhood, and community centers, in addition to single-user net lease properties. Inland Western Retail Real Estate Trust, Inc. is based in Oak Brook, Illinois."   Finviz


Tuesday, July 24, 2012

Tuesday Evening

NFLX and BWLD are getting hammered.... BRCM getting some upside. AAPL on tap for 430pm release... so if you need a bathroom break, you've got 15min lol.

SPX Daily
Now that the AAPL news has been released, I wanted to take a look at the SPX daily chart and see where we stand. You can see the high volume zone from 1355-1375 has increased in size from a few weeks ago.... which should make it more difficult for the bulls to overcome going forward. I think of it as a large group of traders & investors that are hangin' out up there anxious to get their money back. It definitely looks like it'll be tough resistance for the day sessions in the days/weeks ahead. We know the tendency for the markets to gap above or below support/resistance levels using the futures at night though, so I'm trying to keep that in mind as a possibility too.

1310-1320 is the next high volume zone below, and S&P futures are currently indicating an open on SPX of about 1326ish. The 50day on SPX is at about 1332, and the bottom BB is about 1320. With a few short term indicators suggesting we are ripe for a bounce, if we gap down into that 1310-1320 area in the morning, I'm expecting the bulls to step up. The big test is going to be what kind of bounce they produce.... if any at all. If they close it above the 50day at 1330ish, I think that's a "win" considering it (the 50day) is starting to flatten out. It's not all gumdrops and lollipops of course, but depending on the daily S&P futures volume (likely to be high), it would be a start.

If we close below that 1310-1320 zone on SPX, the 1257ish level is back on the table as a possibility. Looking at a few things tonight like the action in the Euro/Dollar, Gold and some other longer timeframe indicators, I think we have pretty decent odds the bulls will try to hold it together. That can all get tossed out the window though with one good whack tomorrow. Stay on your toes... and trade safe.

Gold Futures (Aug) Daily
I wanted to throw in a daily chart of Gold at the bottom here considering it's an evening thread and the length isn't an issue compared to the more actively refreshed day threads. Anyway, I mentioned I would follow up on this triangle pattern... and you can see we are getting into an even more narrow range now. No signals yet... but we are getting closer to a decision point for sure.

Tuesday Afternoon

AAPL 5 minute chart from late Friday - 11:28AM today
As info, today's support/pivot/resistance numbers are:

S1-3  574.20  580.96   592.39 

PP 599.15

R1-3  610.58   617.34   628.77     

Tuesday Morning

It's all about AAPL today ...
This is a picture of the Apple 1 on display at the Museum of American History in Washington, D.C.  It had a whopping 8KB of random access memory (RAM) that was spread across 16 chips.   That was for the top of the line machine.  The standard model only had 4KB RAM and cost $666.66.

You did not get all of the gear in the picture for your $666.66.  You had to supply a keyboard and video monitor.

How much memory does it take?

To store a book (text):

1 page -> 70 characters per line x 40 lines per page (you must include spaces and marks)
2800 characters (bytes per page) -> 2.8 KB ~ 3 KB per page
a book with 500 pages -> 3KB x 500 = 1500KB = 1.5 MB

Bottom line: With no compression technology available yet the original Apple 1 standard model could store less than a page and a half of text in its memory.

Monday, July 23, 2012

Monday Evening

TXN Daily
Texas Instruments hasn't announced yet, but I wanted to look at a daily chart and mark up some areas that might be important going forward. Any move above 29ish will likely point to that 32ish level.

BIDU Daily
Baidu has had a positive reaction so far and you can see the high volume zone between 117-125. I imagine the bears are going to put up quite a fight in that area.

Monday Afternoon

SP-500 Daily Chart (11:30)
This is the same daily chart I have posted multiple times.  I still think the support lines are relevant.  You may or may not agree.  I will be using these levels to make trading decisons in general and for SPY puts and calls in particular.

Monday Morning

Gator's Chart of the Day: PSX
Energy is getting my attention of late.  The XLE has been moving steadily up from its 50 day simple moving average and has printed 6 consecutive green candles.  (You can take my word for it or check out your chart.  I'm not putting one up here.)  One energy stock I'm watching is Phillips 66.  It was a spin off situation and has been trading on its own since the end of April.

Last week I mentioned briefly in the blog that it had qualified for Dan Fitzpatrick's IPO strategy.  We did not discuss it at the time so I'll take a moment to do that now.  Basically, Dan likes to buy a new issue after it has pulled back from the initial high, found support and moved back up to a new high.  Why?  Because interest in the stock has been expressed and there is no resistance to hold it back.  (Makes sense to me.)

PSX fit this general criteria last Monday when it cleared 34.90.  On Wednesday it pushed up to 37.67 before falling back slightly.  It sold off on Thursday and more on Friday where it printed a low of (is this a coincidence?) 34.91.  From that point it moved back higher and closed at 35.52.  This sets up a good low risk entry and trade to the upside.

The Trade
Thie strategy is similar to that described last Thursday for TIF.

Scenario1
If the stock opens lower then wait for support and buy the bounce with a stop a bit below the intra-day low and probably just below the 20 day simple moving average.  Add to the position only if it is already profitable and keep moving your stops up so that in case the market drops you would not be hurt by your position size.

Scenario2
If PSX opens higher wait for the initial enthusiasm to pass and look for a small pullback and bounce to enter. The stop will be a bit looser so the initial position size should be smaller than Scenario1. I would recommend using the previous day's low strategy for stops and add only when each tranche is profitable.

Friday, July 20, 2012

Weekend Thread

SPX Daily

VIX futures positions from the COT report have gotten even more extreme than the chart I posted yesterday. This is a BIG red flag for stocks over the next 3-4 weeks (or maybe longer). Commercials are also pretty heavily net short Naz & Dow futures... almost back to the levels from April-May... which was right before we rolled over. 

I commented about the commercials extreme positions back in MARCH and APRIL, but since it hasn't been worthy of much attention the last few years, I didn't emphasize it as much as I should have. This year, the COT reports HAVE been worth paying attention to.... and I want to share my opinion LOUDLY this time:

BE CAREFUL ON THE LONG SIDE FOR THE NEXT 3-4 WEEKS, or until some of these positions in the futures markets are unwound a bit. These COT positions are generally NOT short term indicators, so it's important to recognize that we could still see some upside. Under the surface though, some of these positions are about the same as they were back in April & May. In the case of the VIX futures, the latest report is showing positions are actually MORE extreme now than they were back then. I encourage anyone playing the long side (I'm currently long so I'm talkin' to me too) to check your timeframes and review the status of all your positions. Tighten up your stops and honor them if they trigger.  


Friday Afternoon

Learned to do this in two tries.

Friday morning


( obligatory cat pic, lol )

Thursday, July 19, 2012

Thursday Evening

COT Report - VIX Futures (Sentimentrader.com)
The chatter on the VIX got me curious about what the big players are doing in VIX futures. This data is delayed a bit (it's from July 13th)... but you can clearly see the large speculators are/were super heavy short, and commercials are/were super heavy long. We will get an update tomorrow afternoon that shows positions up to Tuesday of this week, so I'll follow up on it with any new developments.

Thursday Afternoon

DECK Daily Chart (12:00 Noon)
I posted DECK as a CoD earlier this week and it still looks good right here right now.  I should have bought it but I didn't.  I may correct that and put my stop just under yesterday's low.  That's how I get into stocks that refuse to pause.

Edit: Actually the post was the Tuesday afternoon thread.  http://algofighters.blogspot.com/2012/07/tuesday-afternoon_17.html

Thursday Morning

Gator's Chart of the Day: TIF
I don't think I have ever been in a Tiffany store and I'm sure I've never owned the stock but the chart caught my attention.  Since that nasty news driven gap down in late May TIF continued to slide all the way to the end of June.  It bottomed June 27th and made a decent 10% move higher before pulling back to make a higher low.  Wednesday it completed a "W" pattern and closed above the upper Bollinger band.

The Trade
Now that TIF has made a higher high I see two ways to approach the trade and the opening rotation will determine which one to use.

Scenario1
If the stock opens lower I would look for support and a bounce.  If it is above 51.00 it could be bought with stop just below 49.72.  That's where the stock bottomed in late June.  If you start with a larger position you may want to put the stop on at least part of it just under 50.52 which was the most recent low.  If the stock falls below 49.72 without bouncing .... well .... I won't be interested in the trade.

Scenario2
If instead of a lower open TIF opens higher I would not chase but wait for the initial enthusiasm to pass and look for a small pullback and bounce to enter.  The stop will be a bit looser so the initial position size should be smaller than Scenario1.  I would recommend using the previous day's low strategy for stops and add only when each tranche is profitable.

Wednesday, July 18, 2012

Evening Thread 6/18/12 Ebay


Ebay reported earnings this evening and beat by a penny. (EBAY), today reported that revenue for the second quarter ended June 30, 2012 increased 23% to $3.4 billion, compared to the same period of 2011. The company reported second quarter net income on a non-GAAP basis of $730 million, or $0.56 per diluted share, up 16% year over year primarily due to strong top-line growth partially offset by increased investment in the shopping experience and the impact of acquisitions. GAAP net income of $692 million, or $0.53 per diluted share, reflected a gain on the divestiture of a business in 2012 and increased significantly year over year due to a loss from the divestiture of certain GSI businesses and GSI transaction-related expenses in the second quarter of 2011.


Ebay knifed through support yesterday during the Bernanke selloff but recovered shortly thereafter. It is trading slightly higher in after hours.  I am long and may consider adding here.  Stop goes right below $38.

Wednesday Afternoon

SPX Daily
The S&P500 is grinding up to the high end of the range we've been in for the last month or so. It's a difficult spot to initiate longs unless you have a lot of faith in the breakout theory. I'm stepping aside to see how this plays out. On an intraday basis, S&P futures volume is suggesting a 15-20 point range... and with the low of the day session at 1353ish, the high target area is 1368-1373 (1372-1377 on SPX). Futures are currently trading at about 1367ish and 15min indicators look ripe for selling.

Wednesday Morning

Gator's Chart of the Day: LVS
Las Vegas Sands has been diving since early April and it may not be done yet as it is still above the triple bottom support line but I think there is a short term opportunity here.

LVS Daily Chart (since April)
LVS reports earnings on July 23 so this is a trade I expect to take off (maybe keep a little) before then.  There was better than expected chatter in the WYNN report after market today about Macau not being as bad as had been expected.  I think this is excellent news for LVS and could move the stock on an oversold bounce.  This will be a low risk trade as the stop can be very tight.

The Trade
I will look for an entry shortly after the opening rotation (15-25 minutes) and take a 1/2 position with a stop just below 39.  The low for the last 4 sessions is 39.03 and that appears to be well defined short term support.  If the stock moves higher I plan to add as it passes 41.10.  I don't plan to hold more than a partial position through earnings.  I think the stock can reach 45.50 in the next few days.  That would be a risk/reward of about 1.20 down and 5.00 up.

Tuesday, July 17, 2012

Tuesday Evening

S&P futures recovered after the early dip and closed near the highs of the day. INTC earnings are having a mildly bullish reaction so far in the after hours session... and it could be what the bulls needed to get this market towards 1400 on SPX.

Tuesday Afternoon

DECK daily chart (11:30AM)
After the big dump in late April and further retreat in June DECK has held up well in July.  Even on some nasty down days for the market it has refused to fall.  Monday in the face of the awful retail news it was up on volume that was well above average.  It may be a good ticker to have in your portfolio.  No position here ... yet.

Tuesday Morning

Gator's Chart of the Day: FIRE
I'm taking another look at Sourcefire, Inc.  The stock appears to have found support at the top of the February gap (42ish) and is now consolidating.  I still like their business very much and believe they have products that will be in great demand either from customers or as a takeover target.  They are due to report earnings on July 30th and I'm looking to have a position ahead of that report.  I probably will let some go but not all.

The Trade 
I'll look to take the 1st bite around 43.50 or a bounce from 42+ if the open is a dollar or more below Monday's close of 43.87.  My stop will be fairly tight as I will not want to hold if the stock falls into the gap.  It's possible that what I see as support may just be a pause in a move back to 35.  I would like to add fairly quickly and hold for a move back to the 20 day simple moving average or until earnings (whichever comes first.)

Monday, July 16, 2012

Monday Evening

SPX Daily
It appears we are stuck bouncing around between the lower 2 volume zones marked on the chart. Last Thursday, the bulls stepped up right at the top of that bottom zone (1325ish). Now that we're getting closer to the 1360-1370 area again... I think the bulls have an opportunity to push out of the range. A close above 1370ish will likely point to a push up towards 1400. On the flip, a close under 1320ish will likely point to a push down towards the lows (1266ish). I think there are currently higher odds that we run towards 1400, but earnings reactions will obviously have the last word.

Monday Afternoon

S&P futures have been chopping around under Fridays close (1352ish) after the bulls stepped up this morning near the weekly pivot (1342ish). Volume is pretty light so far... suggesting a 10-15 point range today. The low of the day session is 1343, which puts the high target area at 1353-1358 (1358-1363 on SPX).

Monday Morning

Gator's Chart of the Day: TDW
I mentioned this stock on Thursday and I still like it as we head into the new week.  Tidewater has now broken the downtrend line as it continues to push on the upper Bollinger band.  The 20 day simple moving average has turned up and will be crossing the 50 day this week unless it has a drastic change in direction.  You can see where the bands got a bit tight in mid June and are now expanding nicely.

Earnings are expected on July 30th but the annual meeting is this Thursday so I would expect news from that gathering.  If you have been looking for an excuse to spend a few days in New Orleans this is your chance and you may even be able to deduct the trip.  (Consult your tax professional.)

The Trade
I would look to take a small position ahead of the company meeting and put a stop back in congestion just under the downtrend line.  News from the meeting and trader's reaction to it would determine if (and how quickly) the position is filled out. I look for TDW to trade back up to the mid 50's as a minimum target but it may pause around the 200 day.  That average was support for all of April.  Any good news for shipping or oil/gas exploration can be a catalyst to move this stock. 

Friday, July 13, 2012

Weekend Thread

Colorado
I hope everyone has a safe and relaxing weekend!

Friday Afternoon

S&P futures have been moving up this morning... and we are right at potential resistance here at 1349ish. The intraday volume count is indicating about a 20-25 point range today. The day session low was 1332, which puts a high target area of 1352-1357 on futures... and 1357-62 on SPX.

There was a high volume exchange between 1344-1347 in the futures a few hours ago, and it could be magnetic for an afternoon pullback. If the bulls hold that area, I'm expecting another push into the high target area into the close.

Friday Morning


I heard that someone posted this in the comments here recently... 

so Thank You!
 
It's a great way to get your mind prepared:

 It's going to be a GREAT DAY!

Thursday, July 12, 2012

Thursday Evening

Kauai, Hawaii

Thursday Afternoon

S&P futures bulls are trying to contain the selling so far, but have been struggling to get something going. 1326 is proving to be tough resistance.

The 50day on SPX is 1334ish today... which is equivalent to about 1329 in the futures. If they make a push for that level this afternoon, that would be the 3rd time they've been successful at holding the 50day... although it's still declining.

Thursday Morning

It's a new thread but it's bare.  Sorry about that. 

Wednesday, July 11, 2012

Wednesday Evening

SPX Daily
The bulls stepped up again today and defended the 50day on the S&P500. If they are going to get a rally started, it should start tonight in the futures. If we rally into the end of the week, I'm expecting a move towards 1400 into the end of the month. If the bears take over and get a solid close under the 1335ish level, I'll be watching the 1310 level closely because I think we will be at a high risk of pushing back towards break even on the year (1257ish). Overall, I get the feeling we're at a pivotal moment here... up or down, I want to be ready for it.

Wednesday afternoon

The power of the void

This is one of the best things I learned from spending some time in Pristine’s trading rooms.

Price moves easier when it has no nearby support / resistance to run into.  The lack of reference points leaves a “void” on the chart.  Traders don’t have any obvious point at which to place their bids or offers, so price tends to blow through those empty areas.

Voids can be created by :

1)  Gaps.  Once price enters the gap, it is likely to fill.
2)  Straight up or straight down moves.
3)  Time.  A long sideways consolidation leaves a void both above and below.


When you see a nice void, just think easy money.

Wednesday Morning

Gator's Chart of the Day: BWLD
I've had that white support/resistance line on this chart since last year and it's still relevant.  Below is a shorter term view of the same chart but I wanted you to see where the white line originated.

Looking for a low risk trade right here right now
This may not be a high probability trade but it will be very low risk.  The support line is very clearly defined  and very close by.  While it's difficult to see, the volume has been increasing for the last three sessions and both Monday and Tuesday were above the 50 day average.  Tuesday may have been enough to finish the selling.

The Trade
I would look for an early entry but only if the price is above Tuesday's intra-day low (81.55) at the open or within the first 15-20 minutes of trading.  If not then too bad so sad.  This won't work.  If the entry does present itself I would take a 1/3 or even 1/2 position and plan to add quickly.  This is because the stop will be very tight so the risk is small.  The stop should be about 81.50 so the risk should be 2% or less.  The upside target is inside the upper Bollinger band which should allow a $7 move or about 6:1 reward/risk.

Tuesday, July 10, 2012

Tuesday Evening

Costa Rica

Tuesday Afternoon

5MB Hard Drive - 1959
Maybe Julio remembers these.  I'm not quite that "experienced."

And since it's Tuesday Afternoon .... http://www.youtube.com/watch?v=bPLWBhNW3FM