

Saturday, December 31, 2016
Friday, December 30, 2016
Weekend thread


Rydex Bear Flow at an extreme going back 5 years..... careful out there on the long side heading into 2017.
Rydex Bullish Flow explanation courtesy of Sentimentrader.com:
Time Frame: Medium-Term
Update Schedule: Daily
Construction:
The Rydex family of mutual funds has a selection of funds that cover broad indices as well as narrower subgroups. These funds are popular with market timers, as some of them are highly leveraged.
The most popular funds are based on the S&P 500 and the Nasdaq 100. Rydex makes the asset levels of these funds available to the public each evening, and by observing where these active traders are placing their money, we can get a handle on their sentiment.
We want to see how much money is flowing into the bullish Rydex funds. It would make sense to weight those funds depending on the leverage involved. If $100 million flows into the OTC fund, then we can assume that traders are optimistic on the Nasdaq. But if that same $100 million instead flows into the Velocity fund, which has 2-to-1 leverage, then we can safely assume that these traders are even more optimistic than if they had bought the OTC fund (which does not use leverage).
Therefore, we weight the Velocity fund flows twice as much as the OTC fund flows to account for this leverage. These fund flows are quite noisy, and looking at the day-to-day fluctuations does not seem to be as effective as taking a longer-term view. This indicator measures the amount the 10-day moving average of the percentage of assets in the bullish funds deviates from the 50-day moving average. It gives us a good picture of how optimistic or pessimistic this group of traders is on an intermediate-term basis.
Like all contrary indicators, when these traders become so optimistic that the asset flows into the bullish funds soar higher, it is usually a good sign that any up move is likely to be short-lived, and most likely we will see declining prices. By the time these traders recognize a trend and shift their assets to benefit from it, it is usually too late.
When the 10-day average of the bullish asset flows pulls more than 20% away from the 50-day average, it has been an effective "heads-up" that these market timers have become extreme in the shifting of their assets.
Thursday, December 29, 2016
Wednesday, December 28, 2016
Tuesday, December 27, 2016
Monday, December 26, 2016
Friday, December 23, 2016
Thursday, December 22, 2016
Wednesday, December 21, 2016
Tuesday, December 20, 2016
Monday, December 19, 2016
Friday, December 16, 2016
Thursday, December 15, 2016
Wednesday, December 14, 2016
Tuesday, December 13, 2016
Monday, December 12, 2016
Friday, December 9, 2016
Thursday, December 8, 2016
Wednesday, December 7, 2016
Tuesday, December 6, 2016
Monday, December 5, 2016
Friday, December 2, 2016
Thursday, December 1, 2016
Wednesday, November 30, 2016
Tuesday, November 29, 2016
Monday, November 28, 2016
Friday, November 25, 2016
Thursday, November 24, 2016

Wednesday, November 23, 2016
Tuesday, November 22, 2016
Monday, November 21, 2016
Friday, November 18, 2016
Thursday, November 17, 2016
Wednesday, November 16, 2016
Tuesday, November 15, 2016
Monday, November 14, 2016
Friday, November 11, 2016


Thursday, November 10, 2016

Wednesday, November 9, 2016

Tuesday, November 8, 2016

Monday, November 7, 2016
Friday, November 4, 2016
Thursday, November 3, 2016
Wednesday, November 2, 2016
Tuesday, November 1, 2016
Monday, October 31, 2016

Friday, October 28, 2016
Thursday, October 27, 2016
Wednesday, October 26, 2016
Tuesday, October 25, 2016
Monday, October 24, 2016
Friday, October 21, 2016
Thursday, October 20, 2016
Wednesday, October 19, 2016
Tuesday, October 18, 2016
Monday, October 17, 2016
Friday, October 14, 2016
Thursday, October 13, 2016
Wednesday, October 12, 2016
Tuesday, October 11, 2016
Monday, October 10, 2016
Friday, October 7, 2016
Thursday, October 6, 2016
Wednesday, October 5, 2016
Tuesday, October 4, 2016
Monday, October 3, 2016
Friday, September 30, 2016
Thursday, September 29, 2016
Wednesday, September 28, 2016
Tuesday, September 27, 2016
Monday, September 26, 2016
Friday, September 23, 2016
Thursday, September 22, 2016
Wednesday, September 21, 2016
Tuesday, September 20, 2016
Monday, September 19, 2016
Friday, September 16, 2016
Thursday, September 15, 2016
Wednesday, September 14, 2016
Tuesday, September 13, 2016
Monday, September 12, 2016
Friday, September 9, 2016
Thursday, September 8, 2016
Wednesday, September 7, 2016
Tuesday, September 6, 2016
Monday, September 5, 2016

Friday, September 2, 2016
Thursday, September 1, 2016
Wednesday, August 31, 2016
Tuesday, August 30, 2016
Monday, August 29, 2016
Friday, August 26, 2016
Thursday, August 25, 2016
Wednesday, August 24, 2016
Tuesday, August 23, 2016
Monday, August 22, 2016
Friday, August 19, 2016
Thursday, August 18, 2016
Wednesday, August 17, 2016
Tuesday, August 16, 2016
Monday, August 15, 2016
Friday, August 12, 2016


Thursday, August 11, 2016

Wednesday, August 10, 2016

Tuesday, August 9, 2016

Monday, August 8, 2016

Friday, August 5, 2016


Thursday, August 4, 2016

Wednesday, August 3, 2016

Tuesday, August 2, 2016

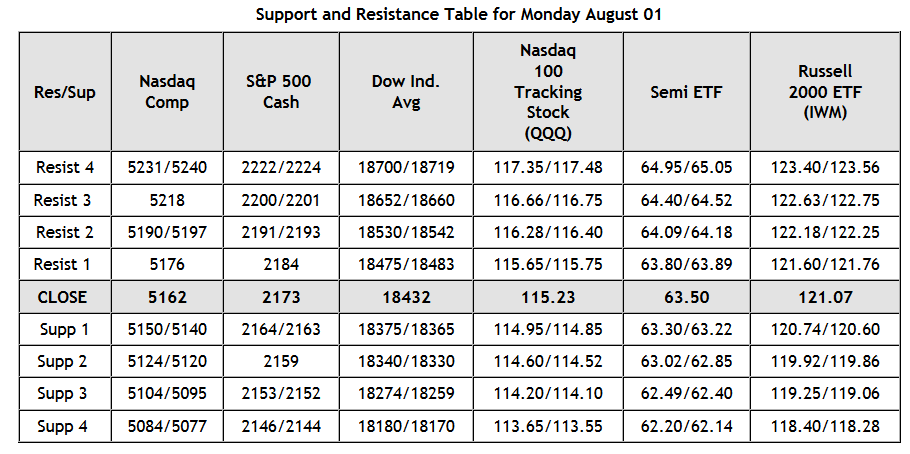
Monday, August 1, 2016
Friday, July 29, 2016


Thursday, July 28, 2016

Wednesday, July 27, 2016
Wednesday Thread
 |
| Don't feel like you have to force trades today. Never a bad idea to relax and take it easy..... |
Tuesday, July 26, 2016
Monday, July 25, 2016
Smart Money / Dumb Money Confidence Spread
 |
| Click for Larger View |
joshin4u: This data is an excellent resource provided by Sentimentrader.com.
Their write up below describes the indicator in more detail:
Threshold Return Analysis:
In order to provide more detailed information about our indicators, threshold return analysis has been performed for each. The below data describes the annualized returns for the underlying while the indicator value is above / below the extreme values as well as the returns of the underlying while the indicator is between the extreme values. Note that the returns provided are describing the periods that the indicator is only in the threshold region (e.g., above, between, below).
| Location of Indicator | Annualized Return | % of Time |
|---|---|---|
| Above Extreme | 15.0% | 17% |
| Between Extremes | 4.0% | 48% |
| Below Extreme | 3.0% | 35% |
Construction:
The Smart Money Confidence and Dumb Money Confidence indices are a unique innovation that allows subscribers to see, in one quick glance, what the "good" market timers are doing with their money compared to what "bad" market timers are doing.
Our Confidence indices use mostly real-money gauges; there are few opinions involved here. Examples of some Smart Money indicators include the OEX put/call and open interest ratios, commercial hedger positions in the equity index futures, and the current relationship between stocks and bonds. Examples of some Dumb Money indicators include the equity-only put/call ratio, the flow into and out of the Rydex series of index mutual funds, and small speculators in equity index futures contracts.
The Confidence Spread subtracts the Dumb Money from the Smart Money. So when the Spread is very high (above 0.25), that means the Smart Money is looking for a rally, and the Dumb Money is looking for a decline; we should expect stocks to rise after those conditions.
When the Spread is very low (below -0.25) then the Smart Money is anticipating a decline and the Dumb Money a rally; we should expect stocks to decline after that.
Note that the "dumb money" is not dumb at all during trends. Most of them are trend-followers, and will get more and more bullish as stocks rise. The "smart money" is mostly comprised of hedgers, and they will sell short as stocks rise. So for much of the time, it looks like we have the terms confused.
But it is when both sets of traders are at extreme positions that they earn their moniker. Dumb Money is most often at their most exposed before stocks decline, and at their least exposed before stocks rally; Smart Money is the opposite.
Friday, July 22, 2016


Thursday, July 21, 2016

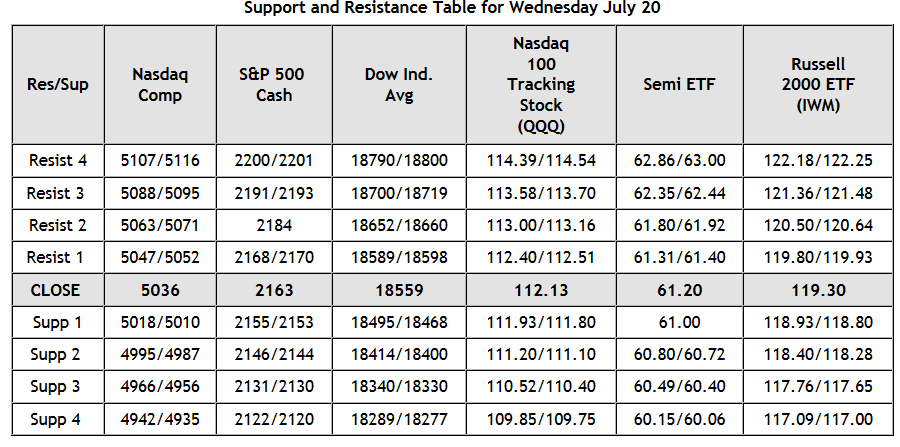
Wednesday, July 20, 2016
Tuesday, July 19, 2016

Monday, July 18, 2016

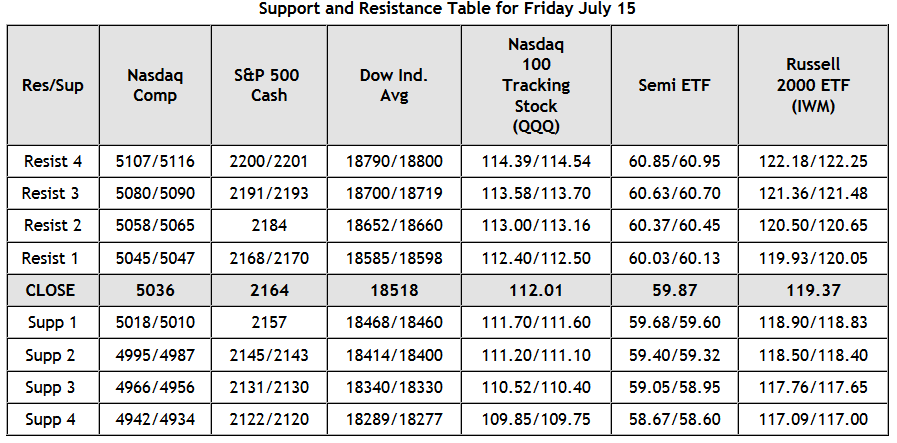
Friday, July 15, 2016

Thursday, July 14, 2016

Wednesday, July 13, 2016

Tuesday, July 12, 2016

Monday, July 11, 2016

Friday, July 8, 2016
Weekend Thread

Gunnison River 2016
A little dirty this year, but the stonefly hatch was in full force!


