 |
| Is there any turkey left? |

Saturday, November 30, 2013
Friday, November 29, 2013
Black Friday - Go buy something
 |
| SP-500 Weekly Chart |
Thursday, November 28, 2013

Wednesday, November 27, 2013

Tuesday, November 26, 2013

Monday, November 25, 2013

Friday, November 22, 2013


Thursday, November 21, 2013

Wednesday, November 20, 2013
Wednesday morning
 |
| Is that a Head and Shoulders developing? |
Tuesday, November 19, 2013

Monday, November 18, 2013

Friday, November 15, 2013


Thursday, November 14, 2013
Thursday morning
 |
| SP-500 Daily Chart |
Wednesday, November 13, 2013


Tuesday, November 12, 2013
Tuesday afternoon
UPDATE - BACK UP AND RUNNNING!
I am having trouble getting the threads to load, thought I might try to put up a new thread.
Edit: nope, still can't get disqus to load. Sorry to anyone else having the same trouble. I just looked at disqus status and they have an outage right now.Not sure when we will be back up and running. Here is a link to check the status: http://status.disqus.com/
UPDATE - BACK UP AND RUNNNING!
S&P futures pushing into the target zone of 1753-1758 here... still have room on short term indicators for selling, so I'm watching carefully.
I am having trouble getting the threads to load, thought I might try to put up a new thread.
Edit: nope, still can't get disqus to load. Sorry to anyone else having the same trouble. I just looked at disqus status and they have an outage right now.
UPDATE - BACK UP AND RUNNNING!

Monday, November 11, 2013

Monday morning

Bottoms are events. Tops are developed. Is a top developing now? We will only know in retrospect. I will say that I find the movements Wednesday - Thursday - Friday to smack of traders feeling like they had to be long followed by a "this is it" Thursday and then the good ol' "it ain't over yet" Friday. Y'all be careful and honor your stops. You are using stops, aren't you?
Friday, November 8, 2013


Thursday, November 7, 2013
Russell 2000

The numbers I used from January were: Head 640, Neckline 868, and the target came out to about 1,100. As you can see on the chart, we are now in the target area. The big question is where do we go from here?
Several intermediate term indicators are showing higher risk on the long side now. I thought we might see 1800 on SPX by Thanksgiving, but a big reversal like we had today doesn't look too good for the bullish case. I still think it's possible though... because so far, the SPX is right at the 20day SMA, and the RUT is at the bottom of it's daily chart BB.
Tomorrow might be a pivotal day.... stay on your toes and trade safe.

Thursday morning
 |
| USO: The trade is on |
The Trade
I may not get in but this is what I would plan: Take a 1/4 position on the next open candle. I would like to buy into the close on that day. My stop would be about 20 cents below the entry. I would look to add another 1/2 position on the first open green candle and fill the last 1/4 on a bounce from an intra-day dip.
The target is a test of the neckline and I would sell into that level. While the 200 day sma has not been particularly relevant the price did fall below and immediately trade back above it so don't be surprised if it makes a mirror image of that action on the way up. If the position is not already full then the bounce would be a good spot to buy the last piece.
Edit: Remember to pay attention to volume. If it is dropping while price is rising you could get left holding the bag if you buy then. If volume is average or above then rising price is your friend.
Wednesday, November 6, 2013


Wednesday morning
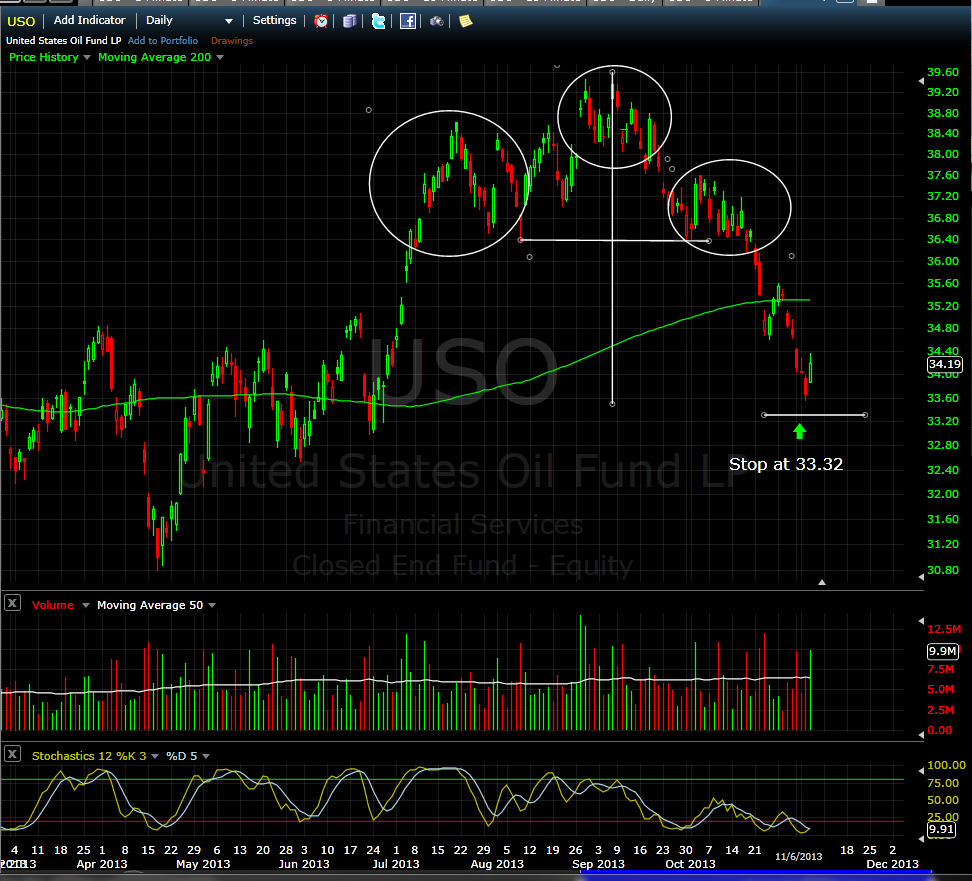
 |
| USO Daily Chart |
The Trade
I may not get in but this is what I would plan: Take a 1/4 position on the next open candle. I would like to buy into the close on that day. My stop would be about 20 cents below the entry. I would look to add another 1/2 position on the first open green candle and fill the last 1/4 on a bounce from an intra-day dip.
The target is a test of the neckline and I would sell into that level. While the 200 day sma has not been particularly relevant the price did fall below and immediately trade back above it so don't be surprised if it makes a mirror image of that action on the way up. If the position is not already full then the bounce would be a good spot to buy the last piece.
Tuesday, November 5, 2013

Tuesday afternoon

Welcome to Lake Red-begon, where every dip is bought
and all the children are above average.


