
Monday, September 30, 2013
Monday afternoon
 |
| So does the market. |
Sunday, September 29, 2013
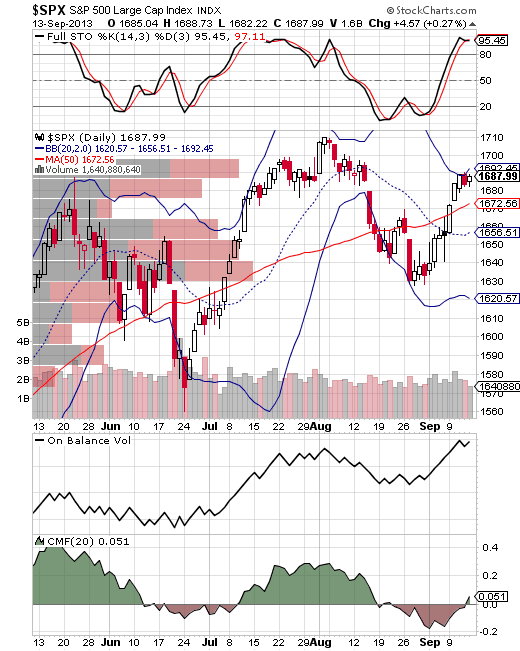
SPX Daily / Weekly
 |
| SPX Daily |
 |
| SPX Weekly |
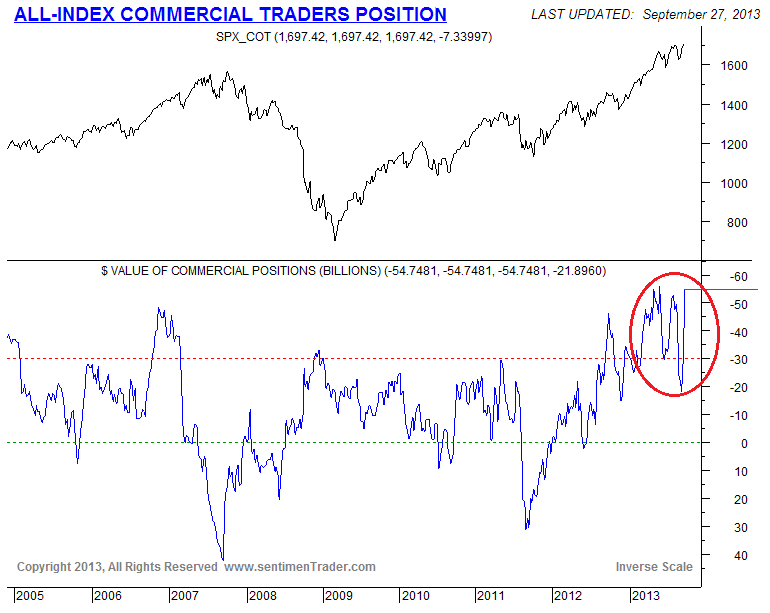
This is the "All-Index Commercial Traders Position" from Sentimentrader.com. It's showing a combination of all the equity index futures positions within the commercial traders group, typically considered the "smart money". The reason it is surprising is that commercials have aggressively increased short exposure across the board this last week and a half, and it's absolutely something to be aware of. It has me rethinking a lot of things right now, first one being that I think I might owe baron some cranberry sauce. I thought the bulls would make a run to 1800 by thanksgiving, but this puts some serious doubt in my mind about that. I am going to be digging deeper into a few things and will keep you posted on my homework.
On another note, please see the comments below for some info related to comments going forward.
Friday, September 27, 2013


Thursday, September 26, 2013


Wednesday, September 25, 2013


Tuesday, September 24, 2013
Tuesday evening @ES

The 60min S&P emini day session looks like 30 point H&S, which targets ~1660. There's a gap fill ~1664. Call it 168 - 167.50 on SPY. There is some support in the 1680 - 1670 area.
Be careful out there.


Monday, September 23, 2013
Monday evening @ES

S&P emini futures 30min day session. A down open tomorrow might fill the gap near 1682 and bounce. But there are some disappointed buyers overhead, so I don't know how vigorous the bounce would be. Take with a load of salt, because I haven't had much feel for the market lately.


Saturday, September 21, 2013
SPX Daily / Weekly
 |
| SPX Daily |
The S&P500 has pulled back to potential support here at 1710. I'm guessing the bulls will step up on Monday and start building again for a move towards 1800. This is based partly on my review of some short term indicators signaling we are oversold, and partly on the simple fact of where we are on the daily chart above.
One thing I've learned (after a long battle, lol) is to stay flexible with my predictions. So... with that in mind, I'm thinking we've got 10 points below here to a more serious battle ground at 1700, and the high volume zones of 1690-1700 and 1650-1660 that could also come into play. If the bulls don't produce much of a bounce off this oversold reading in the short term, I will definitely be re-evaluating and looking at those areas as higher probability targets.
"It's not about whether you are right or wrong, it's about what you
accomplish when you're right, and the wisdom you gain when you're wrong".
That's my rewrite of a famous qoute from you-know-who.
The S&P500 Weekly chart has pushed up into the upper Bollinger Band. Even though the bulls didn't close at the top of the range this week, I'm still willing to give them the benefit of the doubt until proven otherwise.
Ok, Considering it's a Saturday, I thought I would make this post even longer than usual - lol - and put up the following chart:

I was reviewing some longer term indicators on Sentimentrader.com and came across this interesting one. This data is reported monthly, so we are talking long term here... but this is worth staring at for a bit. Here is Sentimentrader's explanation of the indicator:
After staring at it for a bit, I'm definitely debating how much weight to put on this. I always appreciate the brilliant minds that gather here and would love to open this up for discussion. What do you guys (and gals) think?
 |
| SPX Weekly |
The S&P500 Weekly chart has pushed up into the upper Bollinger Band. Even though the bulls didn't close at the top of the range this week, I'm still willing to give them the benefit of the doubt until proven otherwise.
Ok, Considering it's a Saturday, I thought I would make this post even longer than usual - lol - and put up the following chart:

I was reviewing some longer term indicators on Sentimentrader.com and came across this interesting one. This data is reported monthly, so we are talking long term here... but this is worth staring at for a bit. Here is Sentimentrader's explanation of the indicator:
EXPLANATION:Each month, the Investment Company Institute releases information related to the mutual fund industry.Included in this data is the total amount of assets invested in mutual funds, ETFs and money market funds.As a rough measure of investor sentiment, this indicator looks at the total assets invested in equity mutual funds and ETFs, and compares it to the total assets invested in the safety of money market funds.The higher the ratio, the more comfortable investors have become holding stocks; the lower the ratio, the more uncertainty there is in the market.GUIDELINES:Since 1997, this ratio has traded in a fairly defined range. When equity assets were three times greater than money market assets, stocks formed bull market peaks within the next several months.When uncertainty was so high that money market assets nearly overcame equity assets (i.e. when the ratio dropped close to 1.0), then stocks were near their bear market bottoms.There is not necessarily a ceiling on how high this ratio can go - it rose steadily during the 1990s. So it's entirely possible that the 3.0 level will no longer act as a ceiling on this ratio if stocks are embarking on another long-term bull market cycle, it's just something to watch based on history over the past 15 years.ADDITIONAL RESOURCES:Investment Company Institute (www.icinet.net)
After staring at it for a bit, I'm definitely debating how much weight to put on this. I always appreciate the brilliant minds that gather here and would love to open this up for discussion. What do you guys (and gals) think?
Friday, September 20, 2013


Thursday, September 19, 2013


Wednesday, September 18, 2013


Tuesday, September 17, 2013


Monday, September 16, 2013


Sunday, September 15, 2013

Friday, September 13, 2013


Thursday, September 12, 2013

Thursday afternoon
 |
| Gas was .52/gallon |

Wednesday, September 11, 2013
Wednesday evening
 |
| Daily Chart - Tomorrow is important |
Wednesday afternoon

Not sure but that could be the BIDU cloud . Grrrrrrrrrrrrrrrrrrrrrrr!!!!!!!!!!!!!!!

Tuesday, September 10, 2013
Tuesday evening

SPY, DIA, and IWM have some resistance overhead. QQQ continues in blue sky territory (at least in the last 13 years), having made it back to November 2000 levels.