

Friday, May 31, 2013


Thursday, May 30, 2013
Thursday evening
 |
To get the full effect you have to let your tongue hang out and let it flap in the breeze ..... just pretend you're trading TSLA options.
|


Wednesday, May 29, 2013
Wednesday evening
 |
| The picture would be better with a Samsung |


Tuesday, May 28, 2013

Tuesday afternoon
 |
| VZ Daily Chart (11:15 AM EDT) |

Monday, May 27, 2013

Friday, May 24, 2013
Weekend thread

The calendar won't say summer for another 3 weeks or so but Memorial Day is the traditional opening of the pools and that's what said summer for kids up north when I was young. Enjoy your long weekend.

Friday morning

Before you push the buy/sell button, think about how you'll feel all weekend long if you do it. The market will be here
Thursday, May 23, 2013
Thursday evening
 |
| Is it over? |
It was a wild day from a pre-market view of the DJIA futures down more than 135 points to a gain of more than 40 points before closing down a dozen. Are we due for a pullback? Sure. Has it started? Maybe but for the last 7 months it has been right to buy the dips and the Fed walked back some of the scarier language from yesterday. At least that's what John Hilsenrath attempted to do during the FM Halftime show.
Opinions vary on where prices go now. That's why they ring the bell 5 days a week.
Thursday afternoon

As jojo1480 said late yesterday, this is like Mr. Toad's Wild Ride. If it is moving too fast or you just don't have a feel for it now, there is nothing wrong with resting on the sidelines. Things will settle out and you will be able to see a trend again. It may be down or it may be up. As long as you are in sync with it the direction is less important.
Thursday morning
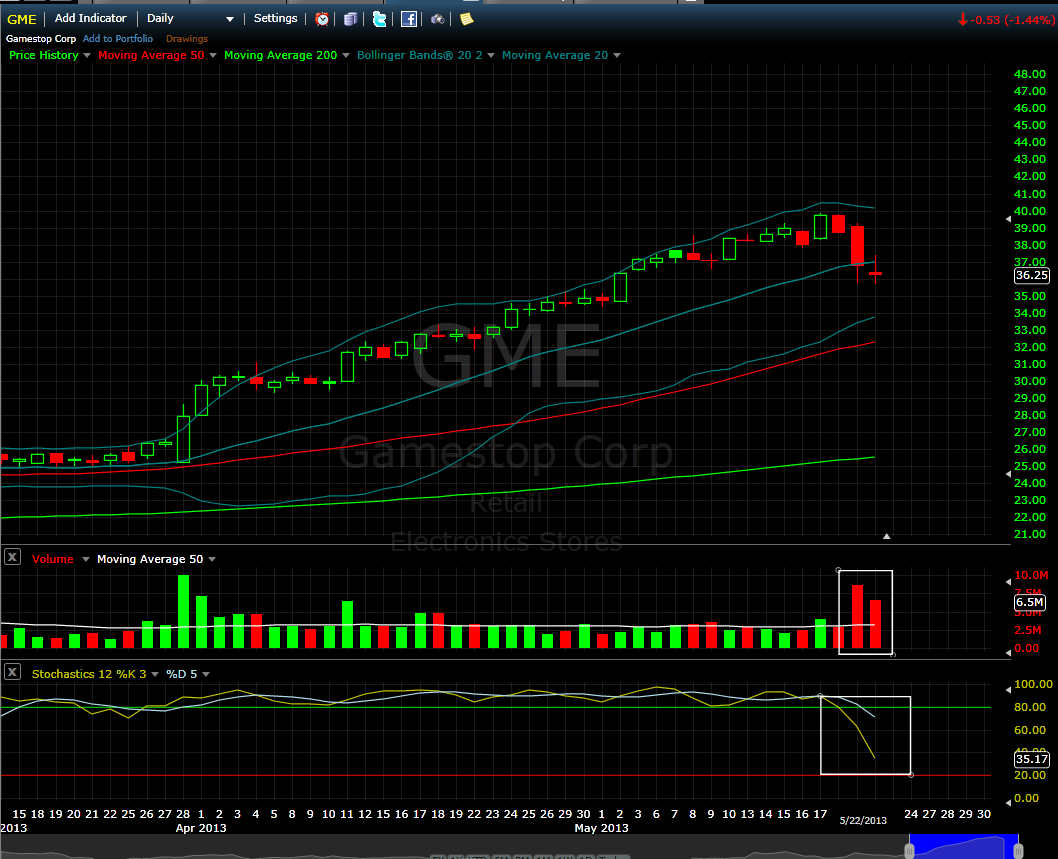 |
| Gator's Chart of the Day: GME (Click chart for better view) |
The Trade
If it sets up this would be a 59er. It could be a gap up and go or it could be a gap down and bounce (my favorite.) If it is the latter then here's the plan.
- Using a 1 minute (super aggressive) or 3 minute (better idea) or 5 minute (you may miss a great entry) buy as the first green candle is printed.
- Place your stop under the low of the day.
- If the stock is still moving up with volume add aggressively and fill your position for the ride up.
- Add stops as you add to your position. This is a winning trade so don't let it turn into a loser.
- If you hold later than 11:30 you should probably take a partial as a lunchtime pullback is reasonable.
Wednesday, May 22, 2013


Wednesday afternoon

Lois took the 5th. Ben danced to questions. Market ran stops up and down.
Any questions?
Wednesday morning
 |
| Gator's Chart of the Day: ATVI (Click chart for a better view) |
The Trade
It's not too late to start a position. (I am likely to add.) The stochastic is not yet in overbought territory so we have room to run. Phase 1 ends when the price stops going up. Phase 2 is the pull back (taking some profits works here) to test the breakout and (assuming a successful test) Phase 3 is the move higher. Buying back or just filling out the position if you have not already should be done here. Ride as far as you can. A good way to stay in the trade but not lose a bunch of profits is to use the previous days low as your stop on part or all of your position. That's the way I learned it from Dan and it's worked for me many times.
Tuesday, May 21, 2013
Tuesday evening

SPY 15min (click for bigger)
There's a double-top in the oval, after barely exceeding the previous highs. Also known as a bull trap. The market will correct someday. Doesn't have to be tomorrow or even soon, but that chart pattern is toppish.
Tuesday afternoon

The Squid told you to buy buy buy and then the market did a quick drop to find those tight stops ("Thank you." said the Squid) and now we find some green and some red. Confused yet? Remember, you don't have to trade everyday. I'm taking my own advice and I'm headed to the golf course. Good luck, traders.

Monday, May 20, 2013
Monday evening
.jpg)
The Cleveland Browns had (possibly) the best all purpose running back to ever stiff arm an outside linebacker. Paul Brown was his coach and he had a fairly simple philosophy: Run it until they stop it.
That's how I am setting up for Tuesday. Stay long until the bears stop it.
Note: In case you aren't old enough to remember, the running back was Jim Brown.
Monday afternoon

There were many opportunities this morning as the market opened in the red but by 10 o'clock if you weren't already in you had to chase a little. That may work out OK if Tuesday follows the pattern it has for the last 4 months but this really feels like nose bleed territory.

Saturday, May 18, 2013
Weekend thread 2
 |
| SP-500 Weekly Chart (5 Years shown) |
Note: Click chart for much better view
Friday, May 17, 2013

Vacation destinations
 |
| ??? |

Thursday, May 16, 2013


Thursday afternoon
 |
| Coffee, tea or me? |
Recognize the friendly flight attendant? (S)he spilled a tray of drinks in a customer's lap shortly after this picture was taken.

Wednesday, May 15, 2013

Russell 2000
 |
| Russell 2000 Weekly |
On a shorter daily time frame, things are looking ripe for a pull back though... stay on your toes. :-)
Wednesday morning
 |
| BTU 5 Minute Chart |
As I looked through BTU's chart on various time frames I found this one. It's a text book H & S presented here on the 5 minute but also shows very well on the 3 minute.
The neckline is the Pivot Point (20.41) with the top of the head at 21.51 that suggests a minimum move down to 19.31 and it didn't quite get there yet. I'll wait to see if it does. A bounce from there would be a higher low on the daily chart and would be a good entry. I would plan to add in size if it moved up through the 50 day sma. Clearing 21.60 looks to be a good place to fill out the position. That should also be just about the place that the 20 day moves up through the 50 day. That could provide momentum to test the 200 day.
 |
| BTU Daily Chart |
Tuesday, May 14, 2013

Tuesday afternoon
 |
| Can't be Friday. They close red sometimes. |

Monday, May 13, 2013

Monday afternoon
 |


