 |
| GLD Weekly Chart (Click chart for better view) |

Wednesday, June 26, 2013
Wednesday evening
Wednesday afternoon
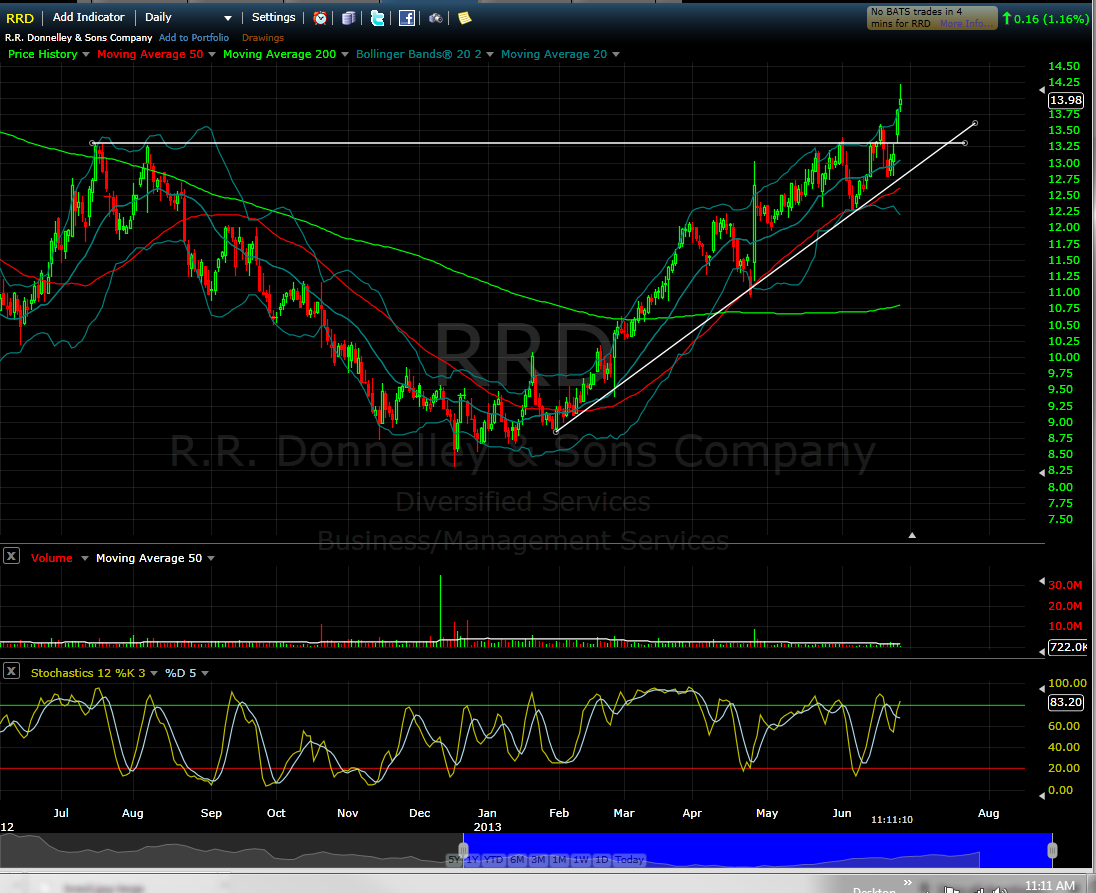 |
| RRD Daily Chart (11:15 EDT) |
Here's a slow money trade. RRD has recently cleared its 2012 high. Watch for a pullback to either the horizontal line or the diagonal support line. If the stock bounces that is your buy and your stop could be fairly tight. You might use 2 or 3% below the horizontal line (if that's the trigger for the entry) or a .25+ breach of the diagonal trend line.
This is a buy and hold stock. They pay an excellent dividend (current yield is 7.5%) and the forward P/E is 8.4. There is also a large short interest to hold up price. Finviz shows the Short Ratio of 21.56 with 22% of the float sold short.
