Today was the second day the bears were able to close under the 20day WMA line (currently 1406ish). That's potentially a red flag for the bullish case. You can see that since June, we haven't seen more than 3 closes in a row below that moving average. It's something to be aware of considering today was day number 2. I'll be watching the 1406-1412 area closely next week.
The latest COT report is still showing commercials are heavy net short equity index futures. They've reduced some short exposure in the Naz futures, but added more to the short side in Dow futures. Basically, this data is suggesting a VERY HIGH AMOUNT OF RISK on the long side right now.
10YR Treasury Futures Daily
Treasury futures (Sep) have pushed all the way back up to the 135'000 area (1.55ish yield). You can see the importance of this resistance level and I'm curious to see what's about to happen. December contract roll started today so I'm thinking some of today's move was amplified because of that. Throw in a little Jackson hole jibber jabber and the bulls were stampeding into the December contract. The interesting thing is, we aren't that far from the highs now. Daily indicators are looking a little stretched up here, but the bulls could just keep pushing if equity futures start to roll over next week.
I have no positions in equity futures right now. I'm guessing the short side is going to work better for September, but am trying to keep an open mind about it.
I found this video of relaxing sounds to get the mind right. I hope everyone has a safe and relaxing weekend!
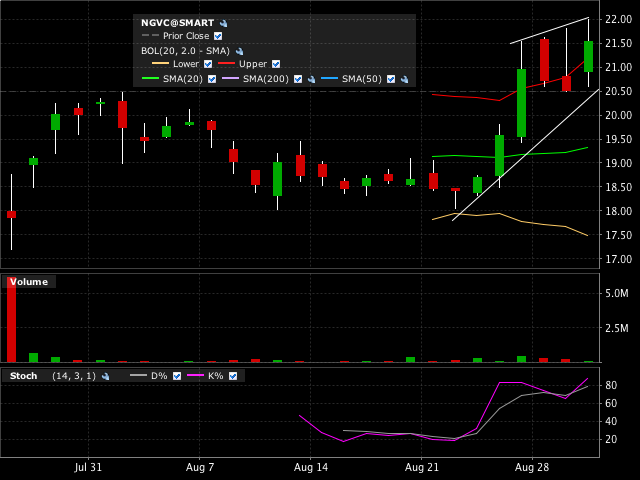
There is a variety of ways to draw your lines but support is $20.50 which is about where it closed Wednesday. The stock is now about $1 from support and about .50 from the all time high set yesterday at $22. You could wait for a pullback, buy when it hits it's all time high or buy now with a stop just below $20.50.
The chart below is a daily chart. I am expecting a breakout in the next few sessions.


