Wednesday, October 31, 2012

Wednesday evening SPY


SPY 60min

That's not a bullish looking chart.  It's still basing near the lows, which often implies continuation.  Would have to clear 142 to change the picture.

The only slightly bullish thing I see is the small inverse head & shoulders, but it really doesn't give me a warm fuzzy.  Trade carefully until this gets sorted out.

AVG - No, not "average" ....

AVG Daily Chart (11:20AM)
Internet security has been getting some press of late and AVG Technologies has a dog in that race.  They use an interesting model that offers customers free service to establish a relationship.  Once the customer is on board the company attempts to up sell by offering fuller featured products.

The stock is consolidating just above the 50 day simple moving average and looks like it is poised to move higher.  We will see very soon as they have an event scheduled for after market today.  That's right this one reports tonight.

As info: I use their antivirus software on my PCs.  Of course I use the free version because it does a good job and I'm a cheap SOB.

Wednesday morning


Trick or Treat

Markets will theoretically open normally today.  NYSE intends to use its ARCA computerized system for the open.  Not sure whether this has ever been done before, so watch out for possible .. irregularities.

Tuesday, October 30, 2012

Tuesday


If this is too irritating, let me know and I'll put up something else.

Monday, October 29, 2012

Monday morning


Welcome to Monday.

Friday, October 26, 2012

Weekend thread


Bora Bora looks pretty satisfactory.
Everybody have a safe and relaxing weekend.

Friday Afternoon - Virus removal company

Most Effective Virus Removal - IPO next month
Recognizing a need that cries out to be satisfied MEVR expects to be wildly successful.  They can address all platforms and operating systems.  Flash drives can be thoroughly cleaned as well.

Friday morning

Thursday, October 25, 2012

SPX & AAPL

SPX Daily
The bulls are putting up a fight in the afterhours S&P futures session to hold that 1400 SPX level. AAPL and AMZN earnings are seeing negative reactions so far, although both have come up quite a bit off their initial lows.

AAPL Daily
AAPL bulls are trying to hold the 600 level in the afterhours session. It's difficult to tell what the reaction will be tomorrow in the regular session, but so far it appears the bulls are making a stand.

Thursday Afternoon

MLNX Daily Chart (11:25AM)
Taking a look at one of Rev's SOTW picks from awhile back.  Nothing to get excited about in my opinion.  It looks to me as if it will be confined by the green and red lines for the time being.  There is a lot of volume that occurred just above the channel to keep it out of the gap and the bottom line has yet to be violated.  With the stock smack in the middle I don't see an edge and don't plan to trade it but news could change that.  I like their products very much.

Thursday morning


Wednesday, October 24, 2012

Wednesday evening

Relax :)

Intraday update

S&P futures have been dripping lower since the cash open and are getting closer to filling the overnight gap at 1406ish. Naz and Russell futures are leading lower, and Naz futures are struggling to hold the 2657ish level.

Wednesday morning


Happy FOMC day
Does Ben have mo' money to give away ?
Find out at 2:15


Tuesday, October 23, 2012

Tuesday evening

SPX Daily
The bears pushed into the 1400-1410 zone today on SPX. S&P futures traded the second highest volume day of the December contract... and I'm starting to get very curious what the COT report will show on commercial positions when it comes out this Friday. The report  will include today's and last Friday's action, which were both big volume days. Today was also the highest daily volume traded so far in the Naz & Dow futures.

With the Rydex Bull & Bear Flow indicators getting closer to looking ripe for buying, we might have a recipe for this 1400 SPX area to hold for a decent rally. Daily chart indicators on S&P futures could use a flat to down day tomorrow in order to be in a ripe for buying setup. Short term Sentimentrader indicators are mixed, and are actually getting closer to looking ripe for selling again. Since we gapped lower this morning, the rally attempts (mostly in the Naz) "used up" some more of the ripe for buying setup from last Friday.

I'm not putting on any overnight or swing shorts until this 1400-1410 SPX action plays out a bit. Naz futures have held the Sunday night lows of 2657ish so far, and that's another reason I'm not very bearish here. I don't have any swing longs on either though, it seems like there's plenty of risk on those too.

Rydex data

Sentimentrader.com Rydex Bull Flow

Sentimentrader.com Rydex Bear Flow
Seems like a good time to check in on the latest Rydex data. This is more of an intermediate term indicator, but you can see we are getting closer to a buy signal on both. Rydex traders have been pulling money out of bullish funds and putting them into bearish funds. These indicators are updated daily, so they're showing data as of the close yesterday.

Targets


To target, or not to target, that is the question.  An argument can be made that it is better to let a trade run until it does something “wrong”, as opposed to getting out at a specified target.  On the other hand, a stock will often reverse when it hits an obvious target, so it might be good to get out there.

It really is a question of style.  Targets can be used in several ways :

In the initial risk / reward calculation
As a spot to take part of a position off
As a spot to take all of a position off
As a gauge to see how well a trade is working

Some areas which make good targets :

Prior support / resistance (overlapping bars or price pivots)
Floor trader pivots
VWAP
Widely watched moving averages

I tend to be all-in / all-out, so I set a limit order at my target point.  If the trade looks like it will blow through there, I might increase the target.  If the trade is acting poorly, I might reduce the target.  But that’s just my style, your mileage may vary.


Monday, October 22, 2012

Monday evening

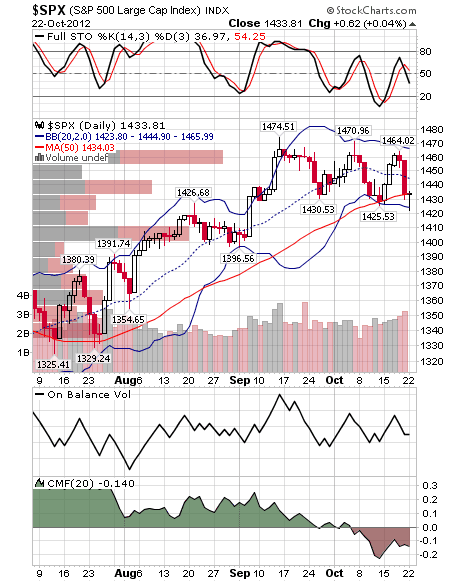
SPX Daily
I've got a friend in town and I'm not trading much. S&P futures have rallied back up to the 50day on SPX. If the selling is going to continue, it should start back up tonight / tomorrow. I just put on a swing short in S&P futures at 1432... stop is set a little above 1442ish. I'm looking for 1395-1405 as a target in the next few days. The 20day WMA on S&P futures is currently 1438ish.

Monday afternoon


Gimme a dollar ...

DLTR Weekly Chart

DLTR Daily Chart

DLTR 5 Minute Chart (10/19/2012)
Today I'm looking at Dollar Tree for a trade to the upside.  If you saw FM Halftime on Friday you may have seen DrJ call this one as his final trade.  Just so you know, Fitz says stay away.  I say, this one has potential and here's why.

Looking at the weekly chart ... that's scary.  Nothin' but air below that nasty string of red candles.  The daily chart isn't much better either.   Still no sign of support and the single green candle last week was a gravestone doji.  (The stock opened at the previous close of 40.52 and closed at exactly the same price.  It traded up during the day so Worden awarded a green candle.)

Here is the glimmer of hope that has me looking at DLTR.  Note on the 5 minute chart the low of the day was made in the first candle.  While you can't see it I'll also tell you it was the tallest candle that printed on that chart.  The low was 38.77.  The long deep red candle on the weekly and daily charts had a low of 38.40.  Some may say it means nothing but I think it's important and traders will notice.  While the stock is still moving down on above average volume that volume has been diminishing.

The Trade
Look for a day that the close is higher than the open.  If today looks like it will meet this criterion then you could take a small bite late in the day.  I would use 38.29 as the stop for this initial buy and if it's violated I would be out of the trade.  (This is 11 cents below that magic 38.40 low.)  I would add to the position carefully and use a higher stop for each add.  Just about every buy in 2012 was above the level of the trade entry so there is plenty of resistance.  Don't expect a fast move higher (but it could) as lots of folks would like to get their money back.

Friday, October 19, 2012

Weekend Thread

SPX Daily
Momo has definitely shifted to the downside. SPX closed on the 50day SMA at 1433ish.... and 1400-1410 seems inevitable. Equity index futures closed out right on the lows, and the S&P's traded the highest daily volume of the December contract. Sentimentrader short term indicators look ripe for buying, but daily chart indicators still have room for selling on S&P futures. This setup is suggesting a potential gap down Monday.

I just flipped through the COT reports released this afternoon and commercials have added to S&P shorts (now very heavy net short), reduced Naz shorts a little (still heavy net short), and are heavy net long VIX futures. They are also heavy net short Dow and Russell futures. Since we are starting to see momentum pickup on the downside, I think it's worth noting that these positions have been building to extreme levels for months. I'm starting to think we are putting in a major long term top here... and will say the same thing I've said the other times I posted about COT data: please be careful on the long side and honor your stops.  

Friday Afternoon - Droid

So far the bears are knoshing on bull parts as tech continues to get hammered.  Let it play out.  It's Friday and not a time to do something rash.

Friday Fire

Gator's Chart of the Day: FIRE
October monthly options expire today and there is likely to be some vicious action in tech with IBM and now GOOG missing estimates this week.  I think FIRE has a good chance of holding this support line.  Note the tall green volume bar that printed Thursday.  If you look at the intraday chart you'll see the stock moved steadily up all day and did not dip when the GOOG news hit the fan.  I am not currently in the stock but I have owned in the past.  (Like when it hit this level in July.)

The Trade
Don't buy if the market is down.  Friday may not be a good day to start this trade so if you do buy some stock don't go crazy.  The stop would be just below 40 so that's fairly loose.  This also suggests the first buy should be relatively small.  The target is the top of the channel which would include a move through the 200, 20 and 50 day simple moving averages.

Thursday, October 18, 2012

Thursday evening


Sometimes, discretion is the better part of valor.
Be careful out there.

Intraday update

S&P futures are grinding back up to the highs here.... although there are some big sellers sitting on the offer around 1457-1458. VIX is probing under 15 a bit... and the Naz and Russell futures are lagging.

Sounds like a nausea treatment but may trigger motion sickness.

Gator's Chart of the Day: MLNX
Mellanox Technologies Ltd. reported after market on Wednesday and they beat estimates on impressive revenue growth BUT the stock sold off hard during the conference call.  (I did not listen nor read a transcript.)  The red support line indicates how far the stock dropped (69.45) and the green line indicates where has settled in (79.50) as of 7:30PM EDT.  This one has 59 Minute Trade written all over it.

MLNX was Rev's SOTW a few weeks ago and that's when I first heard of it.  It's an Israeli company that designs and markets extremely high end switching components for Web 2.0 and "cloud companies."  Mellanox has an extensive product line but the Infiniband systems get the most attention.

Some of our traders were in this one Wednesday night and reported doing well (nice trade, relic) but I think there is a lot more action ahead.  Both stock and option traders should see plenty of liquidity to craft trades.

The Basic 59er Trade
You know the drill by now.  Wait for a green candle on a 3 (aggressive) or 5 minute chart and make your initial buy.  Put your stop under the low of the day because this trade assumes it will not touch that low again. 

Feel free to add quickly if the stock is moving in your favor but each successive add should include a stop that will keep you from getting hurt.  The 10 day average volume is about 810,000 shares but Thursday should see 3 or 4 (or more) times that number

For adds and stops I think sysin3 gave excellent advice on 10/11.  I certainly can't say it any better so I'll just put a link here for you to follow.  http://algofighters.blogspot.com/2012/10/stops-part-3.html

Wednesday, October 17, 2012

SPX... back again

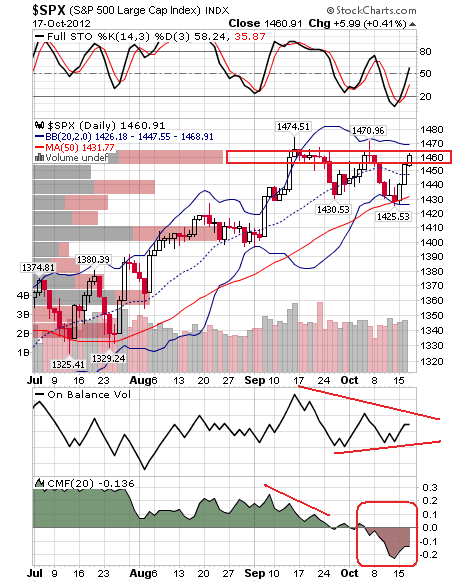
SPX Daily
The bulls have rallied us back up to the 1455-1465 area. Will they go for a break out, or are we still range bound? With the Naz and Russell lagging... I have my doubts about a breakout. I'm trying to keep an open mind though. Short term indicators are still looking ripe for selling, but the fact that we didn't see much selling off the setup today is potentially bullish in the intermediate term. Tomorrow is one of the highest probability up days in October:

October 18 is trading day #14
I generally don't pay much attention to these seasonality charts unless there are a string of +70% days, but I thought it was worth posting anyway.

A few bearish things that I'm thinking about going into tomorrow:

  • It's options expiration week and 1450 might be magnetic based on a quick review of open interest on SPY and SPX
  • Short term indicators still look ripe for selling
  • CBOE P/C ratio has been pretty low 
  • Daily chart indicators are a little stretched and could use a down day to take the edge off
  • Sellers were aggressive in S&P and Naz futures today near the highs

Truckin' Wednesday Afternoon

JBHT - Daily Chart (11:20AM)
This could be a good stock to hold for a quarter or two.  The company reported earnings and the market liked them.  The stock has held that gap up an has been consolidating for a week.  I don't think it will be a big mover but there is very little resistance to hold it back so I could be dead wrong about it.

Apple fritters


AAPL 60min


The Fruit is just not making this easy.  There was a perfectly good H&S which I thought might bounce toward the neckline and then break down toward 605.

But nooo, it bounced a bit and then put in a double (triple) bottom near 623.  That's decent support now.

Then today's strong move took out resistance near 647 (pink line).

So, it really ought to go up a bit more.  But it's bouncing right into a metric buttload of sellers in that grey rectangle.

The yellow downtrend line comes in around 660.  The 50dma is 661.  My completely wild guess is that it will stall around there and back off some.  After that, who knows.

My advice is ... leave this one alone except for very quick trades.  I don't expect it to move fluidly in either direction until it sorts itself out.

[ the preceding is a textbook example of "for what it's worth", lol ]

Tuesday, October 16, 2012

Tuesday evening

ISRG, INTC, IBM earnings on tap.... reactions are slightly negative so far. Toss in another debate tonight, and short term indicators looking ripe for selling, and we have a recipe for some volatility tonight and tomorrow.

Tuesday Afternoon

DDD Daily Chart (10:50AM)
DDD - No doubt there has been a change in character on the chart since the uptrend broke in September.  Watch it here as it has now formed a "W" pattern and if the stock can close above the 50 day (had always been a good buy point) I think that would be an excellent entry for anyone who wants in and has none.  Your stop could be very tight so the trade would be low risk.

Tuesday morning


Trader juice

Monday, October 15, 2012

Intraday update

S&P futures are hovering above the 1432ish battle ground... but 15min indicators are looking ripe for selling. Intraday volume is suggesting we are at the high end of the days range. The low of the day session was 1422, so 10-15 points up would put a high target of 1432-1437. 1433ish is the weekly pivot, and we are currently trading at 1434.

Monday morning

SPX Daily - Still sitting on potential support

Friday, October 12, 2012

Weekend Thread

I hope everybody has a safe and relaxing weekend!

Friday afternoon

Relic is warming them up....

Friday morning

smooooooothe work :)

Thursday, October 11, 2012

Thursday evening

S&P futures closed out at 1428ish after being turned back from the 1431-1432 area during the afternoon session. It never did completely fill the gap at 1426, although it got pretty close. Daily chart indicators are looking ripe for buying here, although Sentimentrader short term indicators are mixed. I'm looking more for setups on the long side (swing trade timeframe).... unless we break down under 1420ish (1425 on SPX). Naz futures closed under 2722ish (potentially bearish), so I'm still stalking that one before jumping in.

Relax :)

Intraday update

S&P futures are starting to pull back a bit..... there are some big bids on the book from 1432-1435. Naz futures are the weakest of the bunch as AAPL is back in the 630's. We are starting to see some volatility.... tighten up the seat belts.... I doubt the bulls are done trying for the day.

Stops part 3


Just a bit more about stops.  In my last missive, I said that I like to wait until a new support or resistance area has been established before tightening the stop.  That’s true, but there are a couple of additional circumstances where I tend to tighten.

1)  Wide range bars.  In general, I do not think that these should be given back.  My thinking is … “the stock has made a very strong move and it should continue if all is well”.

2)  A parabolic move.  When the thing starts going basically straight up or down, I’m watching the dollar signs and not wanting to give much of that back.

Referring to the ESRX 5min chart above (chosen simply to illustrate this post)  (could also be a daily chart, same principles apply) :

A)  Entry, breakout from morning congestion.  (another great entry from the left side of the chart, am I good or what, lol)

B)  Initial stop, placed under the low of the breakout bar.

? ) Here’s a wide range bar, which I usually don’t think should be given back.  Should I tighten there ?  Being a chicken, I probably would, but let’s assume that since the trade is less than 10 minutes old I want to give it some room.

C)  That bar triggers a buy setup which formed from ?) to C).  No way should that be given back, so tighten.  (it would be a good add point too)

D)  Another wide range bar.  The trade is more than an hour old now.  Right or wrong, I would probably tighten there.

E)  Breaking out from a high tight flag.  Notice also big volume on that move.  You want to see big volume on a breakout.

F)  It’s starting to turn parabolic.  Notice that the bar ranges are smaller than the previous wide range bars.  This looks like something they will walk up until it fails, so I like to tighten frequently.

G)  Just a tighten on principle because it’s still going up.

H)  Decent size bar on breakout from a little consolidation.  Definitely should not give that back if it’s going to continue.  Notice a bit of topping tail on that bar.  There be sellers here.  The previous big bars closed more or less on their highs.

I)  Stopped out for about 1.15 gain.

So … to distill my current thinking on stops down to a soundbite … I want to wait until price does something “special” before moving my stop.  “Special”, like “beauty” or “porn”, is in the eye of the beholder.  It seems to me that there is a lot of art in the science of moving stops.  They also call it “trade management”, and that’s where the big money is to be made.

[ please do not presume that I trade in this idealized way .. because I don’t.  I know a couple of traders who do though, and their attitude is something which I am trying very hard to adopt.  Currently, when I get into a trade ... I get rather anxious, I am constantly wondering whether I should tighten stop / move target / kill the trade / check on other markets for a decision / etc., etc. We have met the enemy and they is us. ]

Wednesday, October 10, 2012

Wednesday evening

SPX Daily
We're sittin' on a potential support area here. S&P futures closed near the lows, and Naz futures moved up a few points. Naz futures 2722ish is an area I'm watching closely now... there was a lot of volume exchanged at that level today and it closed slightly above it. If the bulls are going to step up, I'll wait to see that level hold as support before joining in.

Chillax and feel the breeze :)

Wednesday afternoon


Ask and ye shall receive.

Wednesday morning


If you've ever had a dog ...

Tuesday, October 9, 2012

Tuesday evening

SPX Daily
We are seeing another pull back from that 1455-1465 area. If the bulls can't hold the 50day SMA level (1425ish), then 1400-1415ish would be the next potential support area. Sentimentrader short term indicators look ripe for buying.

AAPL Daily
AAPL pushed down to the 625ish level today and found some buyers. You can see on the daily chart that it's at an interesting spot here. It's looking ripe for a bounce back up towards the 50day SMA (655-660). If it just continues lower tomorrow, the next level of potential support is that 600-610 area.

Naz futures traded its highest daily volume in the December contract today. That kind of volume push on a daily chart typically marks a turning point (at least temporarily).... which is another reason I'm leaning towards an AAPL bounce here.

Tuesday afternoon


Ms. Market seems a little cranky today.

Tuesday morning


Monday, October 8, 2012

Monday evening


Happy Thanksgiving to the Canadians on the blog.... I think you know who I'm talking abooooooot :)