
Thursday, April 19, 2012
Thursday Evening
After a wild ride in the early session, the bears took over and closed us lower on the day. That was another failure at the 20day WMA. MSFT is having a positive reaction to earnings so far... up a couple percent in the afterhours session. S&P and Naz futures are showing today as the highest daily volume in the June contract.
Thursday Afternoon Thread
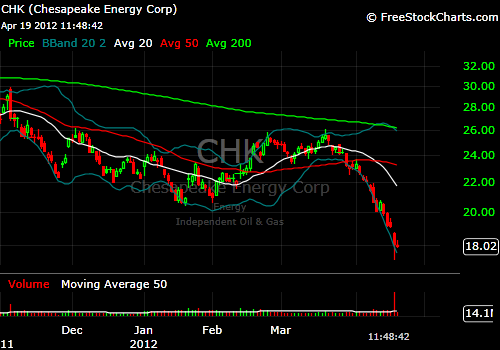 |
| CHK Daily Chart (11:45 AM) |
Thursday Morning Thread
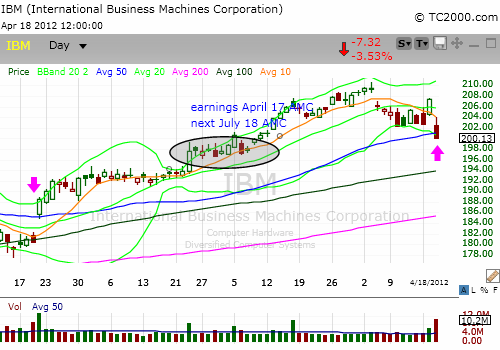 IBM daily chart.
IBM reported earnings Tuesday night and the news was sold Wednesday on 3x normal volume. But there are alot of ominous things on this chart, as I see it. Wednesday's low was 200.00. The close was 0.13 higher, at 200.13. If you look at this chart, 5 of the last 7 candles pretty much have no wick on the bottom of the candle, meaning the stock has closed on the lows for 5 out of 7 days - and that was before Wednesday. Wednesday's (open and) close were below prior support where the bottom of those 7 prior candles sit. (I was going to draw a support line on the chart, but I wanted you to be able to see the bottoms of those candles with no wicks.)
Wednesday's close was outside the lower Bollinger bands - which are narrow, even with Wednesday's spread - at only 5% distance. Wednesday's close was also below the 50 day moving average. I am thinking that a move below 200 will trigger more stops. We could have a volatility squeeze with a downside resolution.