
Strong day today, with the QQQ's leading. The SP500 managed a close over 1300. Options expiration Friday hasn't whacked too much yet ... 
Panther's Chart of the Day
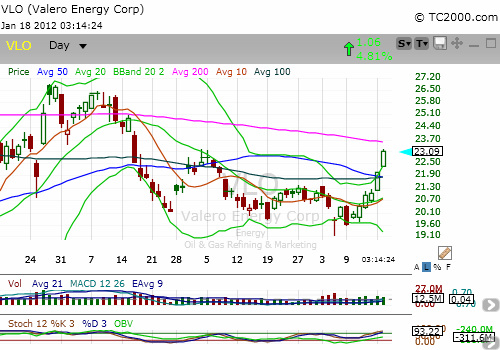
The normal "spring" run in refiners seems to have begun early this year. Normally this happens in Feb. The guys on CNBC are talking "crack spreads." Short hand for refiner profits. They should be dismal for 4th quarter when these guys report earnings, but are already improving.

How do we trade this? UGA (gasoline ETF) is a pretty thin ETF. The refiners themselves are the way to go. The scariest chart right now is VLO, above. We can hope for a pullback to let us in. The weekly chart (above) shows the move in 2011 and why we want in.
Carl Icahn bought 14.9% of CVI recently.
The other "usual" suspects include WNR, TSO, MPC, ALN, HFC (a combination of Holly and Frontier in case you lost track) ... Most of these report earnings in Feb.: VLO reports Jan 31 and I think they are first at bat. MPC reports on Feb 1 and TSO on Feb 2.
Panther's Chart of the Day
The normal "spring" run in refiners seems to have begun early this year. Normally this happens in Feb. The guys on CNBC are talking "crack spreads." Short hand for refiner profits. They should be dismal for 4th quarter when these guys report earnings, but are already improving.

How do we trade this? UGA (gasoline ETF) is a pretty thin ETF. The refiners themselves are the way to go. The scariest chart right now is VLO, above. We can hope for a pullback to let us in. The weekly chart (above) shows the move in 2011 and why we want in.
Carl Icahn bought 14.9% of CVI recently.
The other "usual" suspects include WNR, TSO, MPC, ALN, HFC (a combination of Holly and Frontier in case you lost track) ... Most of these report earnings in Feb.: VLO reports Jan 31 and I think they are first at bat. MPC reports on Feb 1 and TSO on Feb 2.

